
The Power of The Canvas API: A Deep Dive into How We Transformed our Table Performance at monday.com – Part 2
Background
“Boards” are monday.com’s table product that manages and keeps track of all work, from simple everyday tasks to complex multi-step projects.
It’s the core of monday.com and used for many workflows (including our own – it’s how we manage our iterations), which is why we always focus on improving its experience and performance.
For more information on earlier optimizations we made to the board’s scroll at monday.com, check out Moshe’s post and Omer’s article.
This article is a follow-up of our first article about how we increased FPS by 50%.
In this article we’ll explain how we took our table performance a step further by using the canvas API instead of DOM elements to draw our “cell placeholders”.
Important topics to cover before we start:
As we mentioned in our last article, FPS stands for “frames per second”, and it’s a metric used to measure how many times your screen updates in a second.
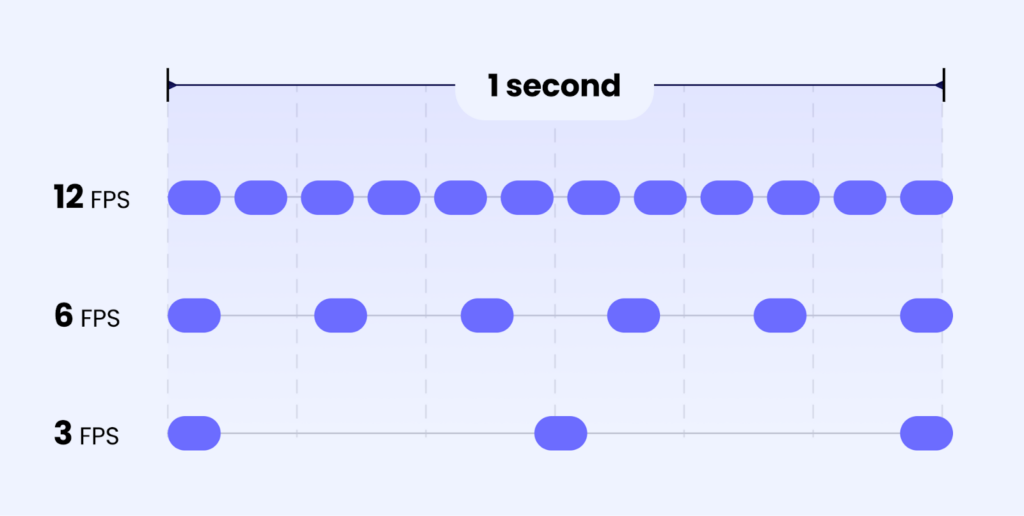
On most modern devices screens refresh at a rate of 60 images, or frames, per second (FPS).
At 60 frames per 1 second (or 1000ms) every frame should take 16 milliseconds to complete.
To hit 60 frames per second in the browser, however, we actually have less leeway than the 16ms limit because the browser needs to perform its own work in addition to ours.
For a more in depth explanation on FPS, check out this article on frame rate.
Context
At monday.com we constantly work on improving our board scroll performance with the goal of improving user experience.
In our last improvement cycle we increased the FPS from 30 to 45. We explained more about it in the last article which will help you understand better some of the context here.
In short, the FPS rate was improved by always rendering a lighter version of the board cells while the user is scrolling. We also optimized this mechanism to execute fewer cell rendering tasks on slower devices and more on faster ones.
Following the improvements we made, we conducted user interviews and discovered that although users were getting smoother scrolling with no interruptions, it would still take some time for all the data to be displayed. We then decided to further investigate this by examining the performance of rendering completely empty cells on the board with the DOM. Our findings revealed that even with empty cells, using the DOM, it was still not possible to achieve 60fps. This meant that regardless of the amount of optimization, it was not possible to reach 60fps while using DOM based cells for our board on any device.
We measured the scroll performance using chrome profiler, chrome profiler lets us see what parts of the code took longer. We saw that what took most of the time was “Recalculate Style”. “Recalculate style” in the browser is the action of matching DOM elements to CSS styling. We tried to research it and optimize it, but nothing we did proved meaningful. It seemed that our CSS and DOM were bloated due to many components and there was no one root cause.
After conducting this experiment with empty cells, we came to the conclusion that the DOM was not the right direction for us, because the results of the experiment were not even close to our desired results.
So we found a way to skip the “Recalculate style” step, and other DOM steps, by drawing directly with Canvas.
What is the Canvas API?
The Canvas is an API browsers provide to draw pixels directly on the screen without going through the mechanisms of the DOM.
This is how you’d draw a red rectangle for example:
ctx.fillStyle = 'red';
ctx.fillRect(100, 100, 500, 500);
You can read more about it here: canvas api
Let’s see an example
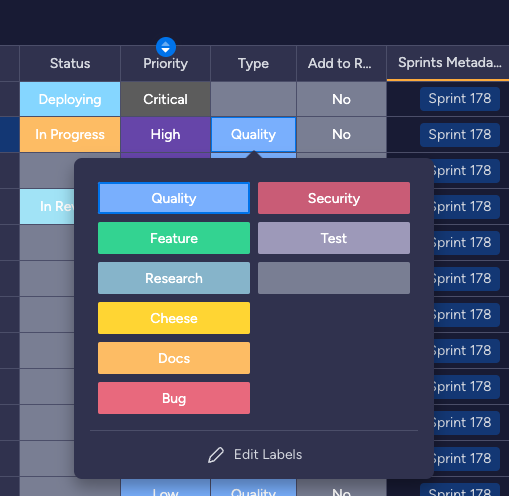
If you’re not very familiar with monday.com, our table has different types of columns to support different use cases and different users. The status column in monday.com is a column type that lets you choose between some status options for your task. The default values of a status column are “Working on it”, “Done”, “Stuck”, but you can customize them to whatever suits you. For example, in my team we have – “Type” status column, that represents what kind of task the task is.
This is what it looks like drawing our status cell with canvas
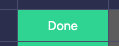
Starting with drawing the green background first:
  // draw background
  ctx.fillStyle = backgroundColor;
  ctx.fillRect(cellLeft, cellTop, cellWidth, cellHeight);
When drawing on canvas unlike dom, we have to specify the exact position coordinates where we want to draw each element, as opposed to using html elements and letting the browser figure out their positioning.
Next, we draw the text “done” on top of it:
  // draw text
  if (label) {
   ctx.font = '400 14px Roboto';
   ctx.fillStyle = '#fff';
   ctx.textBaseline = 'middle';
   ctx.textAlign = 'center';
   ctx.fillText(label, cellLeft + cellWidth / 2, cellTop + cellHeight / 2);
  }
To center this text, in addition to setting textAlign to center which is similar to how we’d do it with css property “text-align”, we also have to start drawing the text from the middle of the cell, that’s why we use the expression “+ cellWidth / 2”.
Why is canvas faster than DOM?
Dom is eventually converted into canvas-like api by the browser.
E.g. Chrome and Firefox use the engine “Angle” which is a layer on top of OpenGL/DirectX, read more about it here, the OpenGL has an api similar to canvas API (just way more low level and complex than canvas). So essentially you are already kind of using canvas behind the scene when you use dom.
Before the browser can draw your website, the browser has to go through your css selectors and dom elements.
Let’s say you have a css selector with siblings
.myclass + .sibling {}When you add an element to the browser – the browser will have to check what siblings your element .myclass has.
The act of matching elements to css by the browser is called the “style” step.
Aside from matching the css into the relevant elements, the browser has to calculate how much space each element will take, as well as where it’ll be positioned.
You probably have some divs placed one above the other.
For example
<div />
<div />
In order to place the second one, the browser will have to calculate the height of the first one to understand where to place the second.
You can imagine on an average website, it’ll get much more complex than this.
Figuring out the sizes and positions of elements is called the layout step.
In canvas if you have a structured table like us, we can just tell it where everything is drawn and with what colors, so it doesn’t have to do these matching and calculations.
Browsers have to take care of many use cases with DOM and accessibility which in canvas we can have a more opinionated view over what we want to draw, so we can skip those cases the browser has to support with dom, and in canvas we can simply draw.
To read more about the pipeline of what browser do on web dev.
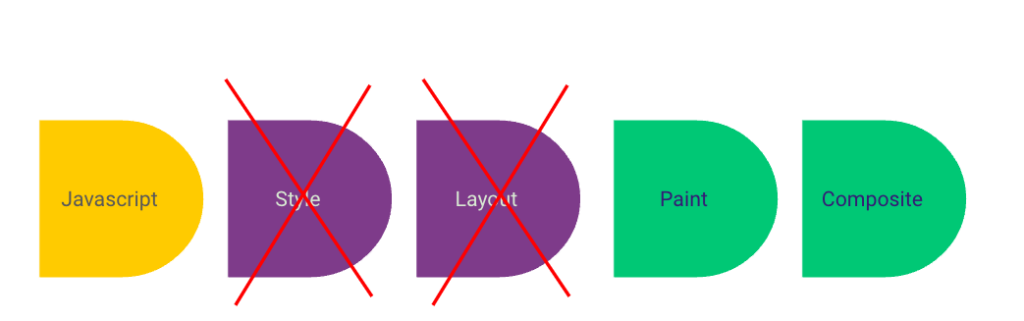
As you can see in webdev article, these are the steps browsers take with dom:
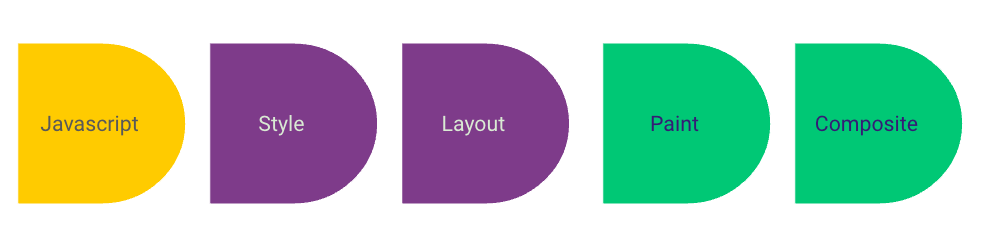
In canvas we skip the “style” and “layout” steps. So the browser has less to do.
Note that once something has been drawn already on the screen with DOM, the browser will probably do it more efficiently with smarter caching and optimization or at least the same efficiency since the browser is usually more sophisticated and has been worked for many years by top engineers. By using canvas we’re not actually smarter and faster than the browser, we just have to support less cases than it and skip some of the work the browser has to do, which we use to our advantage.
In a classical virtualized DOM scroll, every time you’ll get to the edge of the screen, you’ll load more dom elements to the screen.
Adding lots of elements will trigger many style-layout steps. In canvas we don’t trigger such a thing, we just draw the cells on the same existing canvas and by doing this we ditch the heavy actions of adding DOM elements.
Also in addition to skipping the style and layout steps, we skip React lifecycle as well, since our canvas is drawn out of the react cycle.
Our canvas has its own lifecycle – we trigger it every frame.
Where we stand today
As we explained in the last article, currently, board items and cells have three modes: Placeholder, Light, and Full.
Placeholder – this line shows only the item name, no cells. It’s used when the computer is too slow to show data on time without freezing

Light – the cell is ready visually, but it is not functional.

Full – the cell is fully rendered and interactive. It looks the same as Light, but now the user can click it and interact with it.

The Light cell is a bit lighter performance-wise (as the name suggests). It buys us some time because the user will already see the cells before they become interactive— in the meantime we load the full functional cells without slowing down the scroll.
Let’s start with a POC
The issue with where we stand today is mainly with the light step, the light is just not light enough – as we explained in the introduction, even when removing the whole cell content the scroll wasn’t performing with 60fps.
Once we knew DOM is not fast enough, we decided to make a POC with canvas to understand what benefits will we have from using canvas, and whether it’s even possible and if it’s actually faster like our intuition and logic made us think.
At the very beginning it looked something like this. That’s the video from our storybook, which lets us work in an isolated environment with no interruptions:
We tried to load test its performance by drawing even more cells than there are on the screen, just to see how fast it can get.
It was still faster even with 4x times more cells than what we drew on DOM.
We realized we won’t even need a 3 step cycle anymore to draw a cell , like we used to with the placeholder without cells, then light and only then full interactive cells. Because canvas is fast enough to just immediately draw all cells, so we’ll have only 2 steps: one for canvas cell and then one for interactive dom.
Gradual support
Since supporting canvas can be quite demanding and take development time, we took an approach of gradually supporting it. As we have many different types of columns in monday.com to allow different users different usages and use cases.
We have columns such as Person column to assign people, Status column to choose status of a task and many more.
So first we supported just a few board columns of our top used column types.
And even without supporting all column types or not supporting column types at all, we already had some benefits.
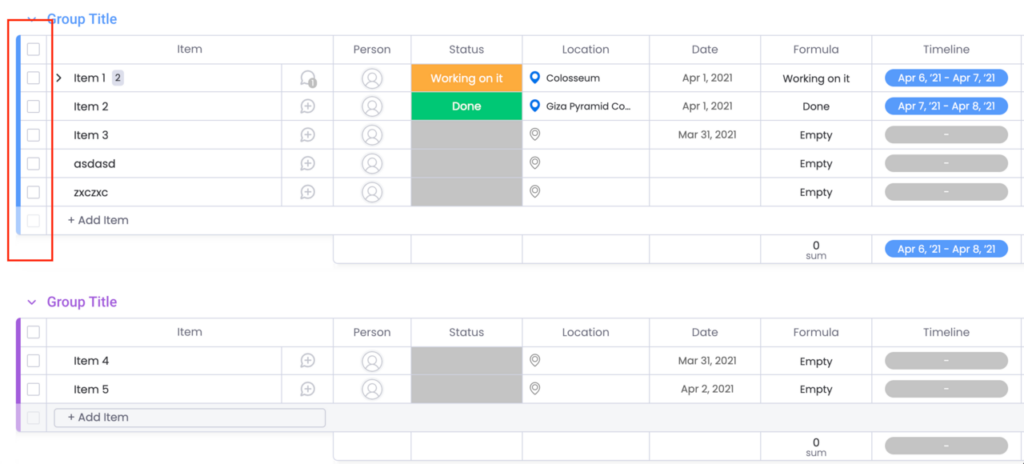
Let’s take this item for example:

Instead of having the old placeholder where we could see only the name of the item:

We could now see all of the cells supported in canvas immediately: status person date and checkbox. We could also see immediately the borders of the non supported cells.
Which gave a better experience, without affecting fps:

Another meaningful experience improvement was with status cells – status cells have background, so when the placeholder without cells was shown first, you could see for a second a white background which was replaced with a green “DONE” cell.
Transitioning from white background to green background seemed very jumpy, with canvas we drew immediately the green cell, so you didn’t have to see a white background for a moment before.
Challenge 1 – scrolling
How do we make the canvas content follow the browser scrolling up/down/to the sides?
There are 2 approaches, one setting the canvas to the size of the board and it will be just scrolled like any other element in the browser.
The issue was that the canvas immediately crashed when the canvas size was too big, the browser couldn’t draw it.
So the second approach was rendering a sticky canvas with the size of the screen and making it sticky so it’ll remain at the same place and won’t get out of the screen when you scroll. Since it’s sticky it won’t scroll, to support the scrolling we move the content itself of the canvas to make it look like it’s scrolling, every time the board scrolls we move the canvas content accordingly. Which is what the browser does behind the scene.
ctx.fillText(“text”, x - scrollElement.scroll, y - scrollElement.scrollTop)We do it in a bit more elegant and efficient way but that’s the idea.
Challenge 2 – combining canvas with previous DOM mechanic to gradual support
Since we used a hybrid approach and using canvas and dom together in order to gradually support canvas. There were some challenges with using canvas and dom together.
First, how can it be faster if we still draw dom to support it gradually.
Second challenge with it, our canvas cells are only non-interactive placeholders, when will we hide them and draw dom interactive cells instead?
For the first step, to make sure we won’t have a slowdown of dom and canvas running together, we debounce dom virtualization to run only if the user stopped scrolling for a few frames.
This way it would run canvas all the time, and DOM only once the user stopped scrolling.
Debounce is when you limit an action to happen only once in every time period.
The reason we used frame based debounce and not regular time based as you usually would, is that if someone had a lag of a second for one frame we didn’t want to trigger the old mechanic, because the user didn’t actually stop scrolling, but just had a lag that blocked them from scrolling. So instead we counted for 5 frames without scroll instead of x seconds without scroll.
Okay so during the scroll the dom won’t slow the canvas, but if the canvas is always drawn wouldn’t it slow the dom once you stop scrolling? How we approached it, is if everything becomes interactive dom already and the user doesn’t scroll, we let the canvas rest and don’t draw anything on the canvas anymore.
In addition to not drawing canvas when it’s not needed anymore, the way canvas works, by default if you don’t clear the canvas, it will keep drawing what was last drawn in the previous frame. This way we could optimize the canvas to skip frames.
If nothing was changed on the app since the previous frame – we skip the frame and draw the same canvas frame.
And to make dom finish faster, we could also skip the step of placeholder where empty cells are drawn and also skip the light step where light dom elements were drawn, and we could just draw full interactive cell immediately once the user stop scrolling, without having the additional step of placeholder + light which were covered by canvas already.
As for the second challenge with combining canvas and dom, when do cells become interactive?
We draw canvas as a layer on top of the dom, so once a cell is on the dom since the canvas is above it, it would hide it, and you wouldn’t be able to see your interaction.
To solve that, once we detected a cell is on the dom we stopped drawing it on canvas.
Challenge 3 – no jumpy transitions
Since we first draw a canvas cell as a placeholder and then gradually draw more dom cells, if there is any difference between the dom and canvas it would pop to your eye.
Every pixel that is different in canvas could be seen as a jump, once it’s replaced from canvas to dom.
To make sure there are no jumps when replacing canvas to dom, we made a few tools to help us with it.
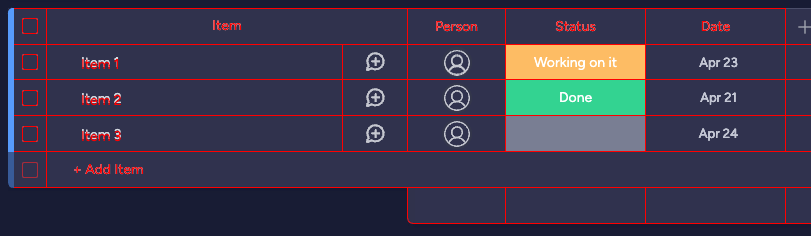
One thing we do to find the difference between the DOM and the canvas while developing – we open a flag that makes the canvas drawn in red, and below it the dom, so we can easily see differences.
For example if the name column position would be drawn 2px lower than it should, it’d look like this:
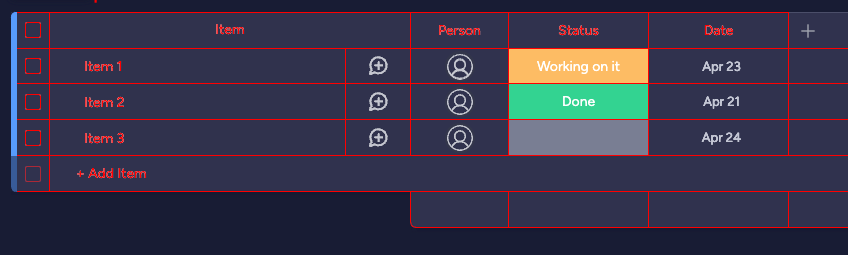
After fixing it, it’d look like this:
That’s what the name column jump looks like, look at how name jumps after the stop:
Also to make sure the jumps won’t break we used a screenshot testing tool over cypress, we take a screenshot once with the canvas and then without, and we compare the two, if the difference of pixels is bigger than our threshold we fail the ci.
There were some features we originally didn’t plan to implement on canvas yet, and let them appear only on the full version, but we saw that if an element doesn’t appear on canvas right away, the delayed appearance of the element might feel too jumpy.
For example the feature conditional coloring, a feature where according to a condition items are drawn with different colors, we originally planned to not support it in the canvas placeholder, and show the colored background only once it’s full, but it felt too jumpy in practice jumping from white background into colored background.
Challenge 4 – profiling code that takes less than 0.1ms
Browsers profiler works in polling, meaning it takes a snapshot every once in a while – in chrome it’s every 0.1ms, it then compares each snapshot to the previous snapshot, this way it knows how long each function in a call stack took. The downside of polling profiling, is that first it won’t show function calls when they take less than 0.1ms, and second it might not show precise enough duration.
We then decided to try to measure parts of the code with performance.now() but found out performance.now() is also not accurate enough (unless you configure some headers), read here about performance.now reduced time precision in mozilla’s document.
And each 0.1ms is meaningful for us, because we need frames to take less than 16ms to keep 60fps.
It might sound a bit petty, why would we care about something that takes less than 0.1ms? To demonstrate why it’s critical – let’s do some math, if one cell takes 0.2ms and we have 20 items and 10 columns on screen = 200 cells each frame.
That would mean 0.2ms * 200 cells = 40ms which is way too much.
To calculate how many frames per second can the browser run with 40ms drawn every frame, we can calculate: 1000ms/40ms = 25fps. 25fps is far from our destination. Each cell has to be drawn in less than 0.05ms in order for it to sum up less than 16ms and keep 60fps.
How we approached measuring cells efficiency, we made a benchmark code that takes a function, and checks how many times we can run a benchmarked function in 16ms.
The code to run such benchmarks:
export const runBenchmark = ({ times = 100, func, beforeEach, runDuration = frameMs }: BenchmarkOptionsSingle) => {
  let sumTimes = 0;
  let countTimes = 0;
  for (let i = 0; i < times; i++) {
    const start = performance.now();
    let doneTimes = 0;
    while (performance.now() - start < runDuration) {
      beforeEach && beforeEach();
      func();
      doneTimes++;
    }
    const duration = performance.now() - start;
    const timesInARunDuration = (doneTimes / duration) * runDuration;
    sumTimes += timesInARunDuration;
    countTimes++;
  }
  return sumTimes / countTimes;
};
So you can just call it like this:
runBenchmark({ func: () => ctx.fillText(“my text”, 10, 10));To know how many times you can draw a text in a frame.
Then we drew some cells, and we saw how many times a frame can we draw each type of cell. The results would be different in each computer, which is why we also ran the benchmark over users’ computers in sessions with them.
Other cool benefits with canvas:
You can cache drawings in canvas, so if you have a repeating piece, such as a checkbox and the group color to the left of it in our case, you can draw it once, and then use cache to redraw it and reuse it. Which you can’t do with dom.
You can read more about off screen canvas on mozilla’s document.
Another cool benefit is that you can profile and see what is slow, instead of the profiler dom “recalculate style” which doesn’t tell which css selectors are slow. Here you know which drawing functions are slow and you can optimize them.
Sum up & results
So now we had our board scrolling faster, and we could see much more data.
Improving our board scroll experience, and having a scroll we’re happier with.
There is actually even more to it than what we could explain in 2 articles. So if you’re interested in asking questions or interested in working on board performance yourself you can contact us at