
How We Improved monday.com Board’s Scroll Performance: A Case Study on Boosting FPS by 50%
Some context
“Boards” are monday.com’s table product that manages and keeps track of all work, from simple everyday tasks to complex multi-step projects.
It’s the core of monday.com and used for many workflows (including our own – it’s how we manage our iterations), which is why we always have focus on improving its experience and performance.
For more information on previous optimizations we made to the board’s scroll in monday.com, please read Moshe’s post and Omer’s article.
Important topics to cover before we start:
FPS stands for frames per second, indicating how often your screen updates in a second.
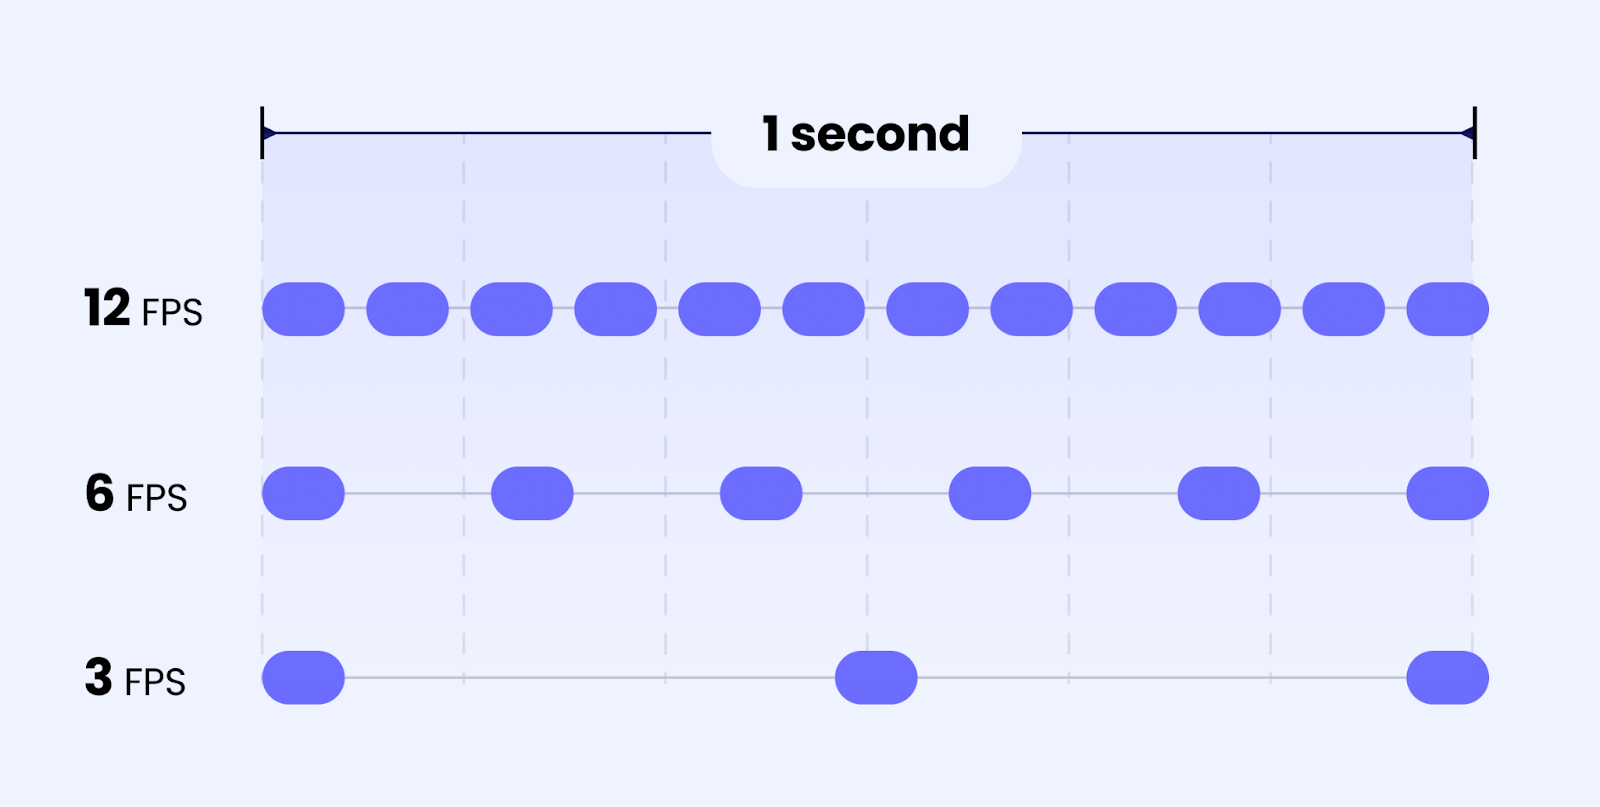
In modern environments, most screens refresh at a rate of 60 images or frames per second (FPS).
Each frame the browser renders takes one second, equating to 1000 milliseconds.
With 60 frames per second in 1000ms, every frame should take 16 milliseconds to complete.
To keep 60 frames per second in the browser, however, you cannot exceed the 16ms limit. In reality you actually have less because the browser needs to perform some actions in addition to what you do.
For more of an explanation on FPS, check out this article on frame rate.
Our initial motivation
At the beginning of 2022, we decided to launch a completely new and improved board look.
As part of our release process, we ran a performance test with our new UI changes against the old experience. We were shocked to realize the new look was slower than the old one.
Without completely giving away all the spoilers, our team turned this obstacle into an opportunity and dove deep into improving the board’s performance. We built more tools for performance research and discovered several ways to optimize the user experience.
One of those was improving the board scroll, resulting in significant performance improvements – from an average of 30 frames per second to avg 45 frames per second.In the next few minutes, we’ll highlight how we found these improvements and what it is that actually improved.
Where we stand today
Currently, each board cell has three modes: Placeholder, Light, and Full.
Placeholder – this line shows only the item name, no cells. It’s used when the computer is too slow to show data on time without freezing

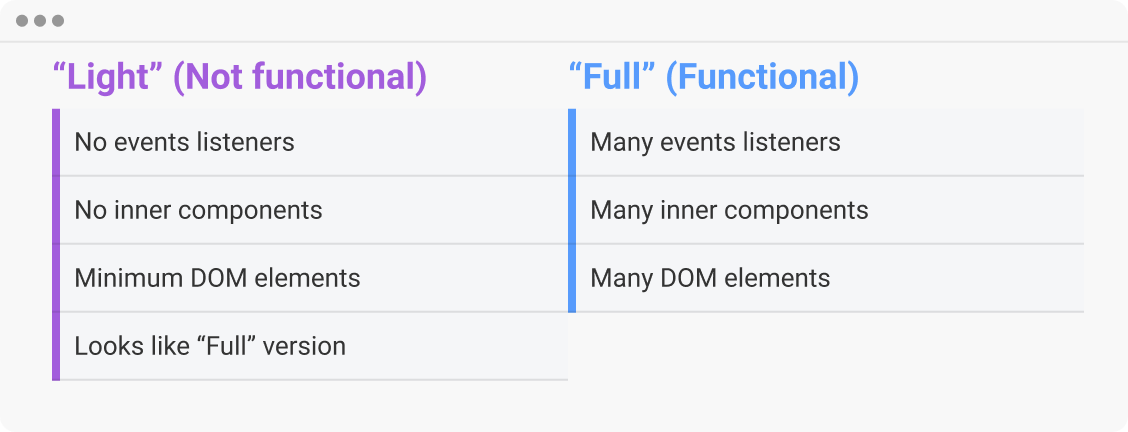
Light – the cell is ready visually, but it is not functional.Full – the cell is fully rendered and interactive. It looks the same as Light, but now the user can click it and interact with it.

The Light cell is a bit lighter (as the name suggests). It buys us some time because the user will already see the cells before they become interactive— in the meantime we load the full functional cells without slowing down the scroll.
Ultimately, after drawing every cell, the board checks the amount of time left for the frame (16ms, as explained at the beginning) and decides whether or not to draw another full cell and another line of light cells. Keeping the process and different modes in mind, here’s how we went about improving the performance.
Step #1 – Benchmarking done right
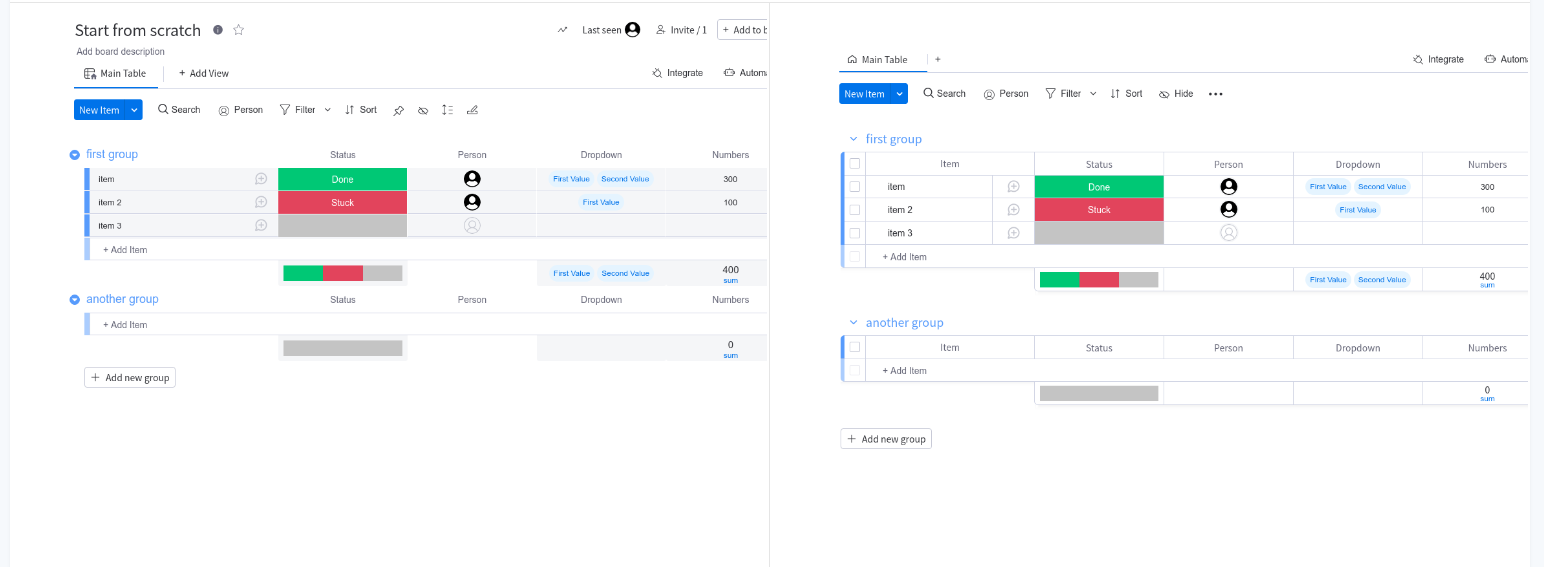
We created a new board experience to make our boards easier to use but we saw a decrease in our scroll fps. This is what the board looked like before and after the new experience (left – old experience, right – new experience):
We wondered what exactly caused the fps to drop. We probably have more elements and data now, but which element exactly caused it and how can we find them and fix it?
First, before we started optimizing the cells, we needed a convenient way to measure the frame rate.
We didn’t want to rely on user data to know whether performance was improved or not, because it would be too late. And we wanted to be able to make different experiments to see how they affected performance without affecting users. And we needed fast feedback to know we were in the right direction without waiting days for each result.
We used to have a post deployment tool for measuring performance. After every deploy of a new version, the tool benchmarked a few use cases and notified us about the new version scroll fps. We could also open feature flags for use of that tool, this way we checked performance before we released features to users.
But since our release process changed from deploying every 1 hour to every 2 days as monday.com devs grew, this post deployment tool was too slow for us to get any feedback about performance, and it wasn’t ideal in many other ways.
To solve that, using Storybook, we rendered a board, let it scroll at a constant speed, and measured the frame rate so we could receive immediate, reliable feedback on every change. Here’s what it looked like:
#Step 2 – Optimizing cells
We knew most changes in the new board look were in the name cell, so we tried simplifying our testing environment by initially including only the name cell in our story.
Now that we have the storybook benchmark, we could use the “divide and conquer” strategy easily until we found the guilt. We created multiple stories, with each story representing different use cases, e.g. board with many small groups, board with many columns, board with only name column, and more to help us isolate the issue. We wrote these stories once, and we’re still using them today whenever we want to check performance.
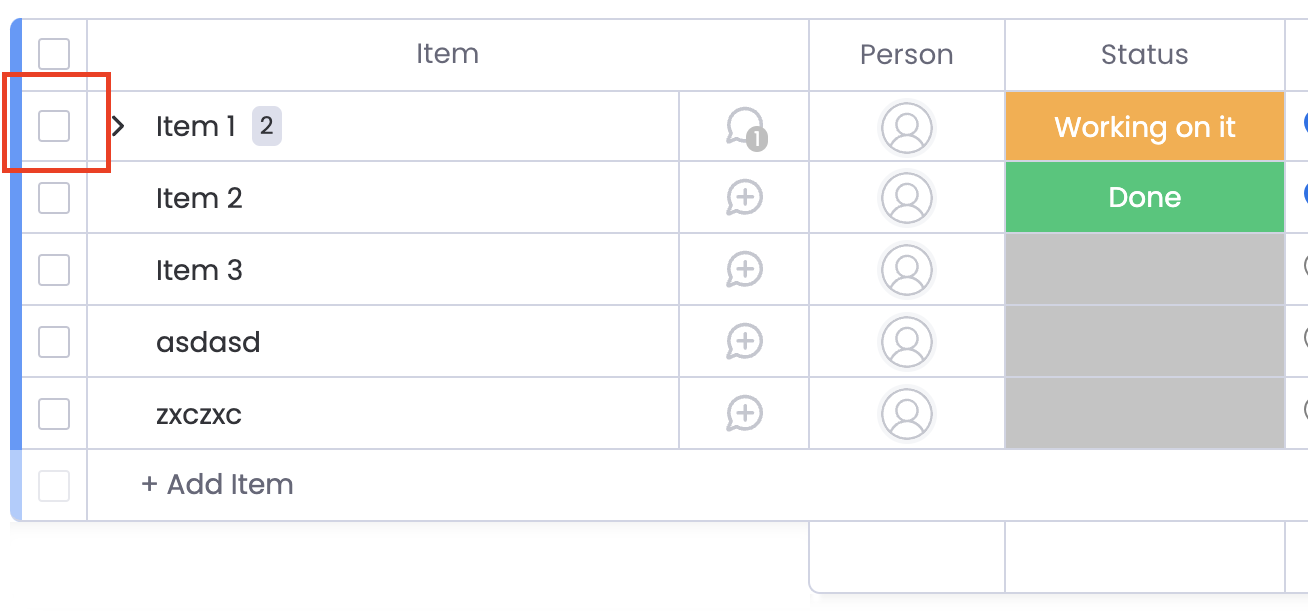
We discovered that the checkboxes on the left were slowing us down by two frames per second.
By making their light version made from only two HTML div blocks, we improved the frame rate and with a few other similar changes, we improved the frame rate to almost the previous version – an avg 30 frames per second.
By making small changes, we dramatically changed our FPS.
Quick tip – finding performance issues
As developers, we usually have stronger computers than our end users, so we might not immediately notice performance issues while developing.
In chrome dev tools, try using the 4x slowdown to see how slower computer might see your app:
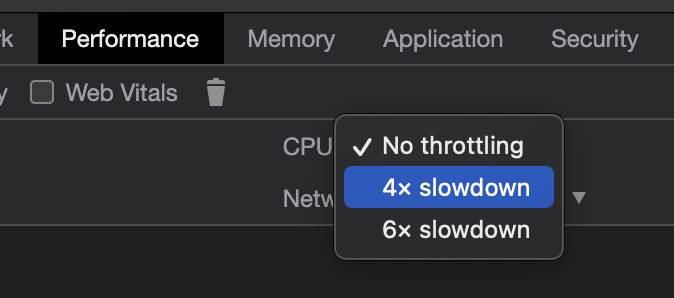
When using Chrome’s 4x slowdown, we noticed that the board was slower, which is obvious.
But, we also noticed it worked harder and rendered more full cells and fewer placeholders in comparison to a faster computer without Chrome’s slowdown.
It was the opposite of what we expected with a slower/older computer. It should have tried to do fewer things, not more. Therefore, we realized we needed to do more research.
Step #3 – researching the placeholder/light/full mechanic
After looking at the code with the rest of our team, we found that sometimes the board renders additional full cells even if the computer is slow, which led us to find a bug in the cell mode decision logic.
It was faster in our local benchmarks after we fixed the bug, but the data we received from our production performance monitoring did not improve –, the percentiles and average fps remained the same. We realized that different users scroll at different speeds, using different data, so the benchmark wasn’t representative enough, and optimization affected the benchmark more than it did the users. Maybe we improved a few cases from this specific optimization, but not enough to see a significant improvement in the data.
Lesson learned: to estimate a test’s effect on users, it’s important to simulate as many user behaviors as possible.
Instead of giving up – we found another way to optimize the board scroll.
As we investigated this issue further, we decided that during scrolling, we didn’t need cells to become full interactive cells at all—this way they could stay light. We added this condition, allowing us to scroll faster with only light cells.
Step #4 – taking into account everything happening during the frame
Through our research, we learned how the board renders cells and manages its queue of cells to be processed. Each frame, the board starts with the first cell in the queue and checks how much time has passed since it began processing cells. If less than 16ms have elapsed, the board takes another cell from the queue and continues rendering. This allows us to optimize the board’s performance and ensure smooth, efficient scrolling.
The problem:
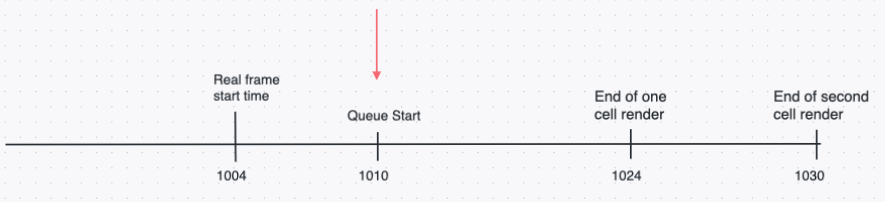
Each frame, when deciding whether the board should wait for the next frame or render a cell, considered the amount of time that passed since the queue began with the current frame. It didn’t take into account how much time passed in the current frame until the queue woke up.In other words, the queue didn’t necessarily ‘wake up’ in the beginning of the frame. This caused the queue to render the first cell, since from the queue point of view, the current frame had just started.
The red arrow represents where the queue thought the frame started. In reality, the frame started before the queue, meaning the queue thought it had more time to draw the frame than it actually had, and it could draw two cells (as seen in the image above).
The solution:
We checked how much time passed since the previous frame, instead of starting from the time the queue woke up.
After fixing the queue code, both slower and faster computers skipped rendering cells when they couldn’t catch up.
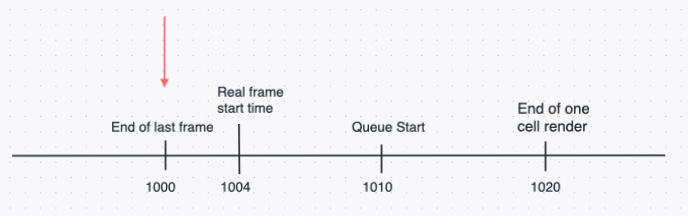
The red arrow represents where it now thinks the frame started, not having much time to draw cells. You can see it doesn’t render another second cell this time, because the time for the frame has passed already.
Step #5 – mouse events during scroll
We also noticed that hovering the mouse during scroll slowed the frame rate, so we removed mouse events.
In the beginning, we changed the board div wrapper pointer-events, but later found that it was slow and caused a huge recalculation of style.
This change affected every element inside the wrapper, so with this one change we could potentially affect 100 elements.
To solve it, we changed it to have a covering div and altered its pointer-events, this way we would affect only one element.
This improved the frame rate to around 3-5 frames per second when the mouse was on the screen.
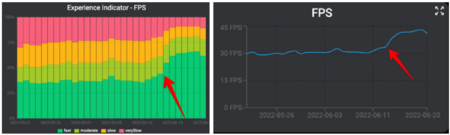
The results
After making the changes mentioned above, we were able to achieve a significant improvement. In the old version, the average frame rate increased from 30 to 45, while in the new version, it increased from 25 to almost 45.
Even though we were pleased with the new results, we felt that we could still do better.
The Importance of User Experience in Product Performance
Our recent product updates successfully addressed many users` concerns about frame rate and stuck scrolling. However, we heard from users that the changes also resulted in more placeholders and slower data loading.
In response, we held meetings with these users to better understand their experiences and gain insight into how they perceive our product’s performance.
This feedback highlighted the importance of considering not just raw performance metrics, but also the overall user experience.
Their feedback inspired us to start measuring cell appearing time, not just frames per second.
Taking a new direction
We tried benchmarking again to make the board’s scroll faster, this time removing the cell content completely to see how much faster it could get without anything in the cell. To our surprise, even then it wasn’t 60fps. Using Profiler, we found that “recalculate style” and DOM rendering took most of the time.
When a browser recalculates style, it matches the CSS selectors to elements in the DOM.
There is no easy way to debug recalculate style, since the data Chrome and other browsers provide is very limited. While using, making, and modifying some tools to find offending CSS selectors, we were not able to come up with anything that would make a meaningful difference to our user experience.
We also changed some code to use CSS modules, so the “recalculate style” would have fewer selectors to go through. It was not enough though to have CSS moduled code when we had some non CSS moduled selectors such as “div > *” because such selectors could match many elements, and they slow the recalculate style.
Additionally, we considered using shadow DOM api, but opted against it because the process was demanding and it wouldn’t yield the results we wanted.
When dom is not fast enough – the new direction we found
To test a non-dom solution, we used canvas while scrolling instead of placeholders and light modes.
Our scroll was so fast, we didn’t even need the placeholder mode, where just the name appeared and always showed light. Users would be able to see much more data while maintaining the same frame rate.
By using canvas api we were able to skip the heavy DOM overhead, and calculations that the browser needed to do in order to transform our data into react components and then into dom elements and then into renderable data. We could use canvas api to directly render our data without this heavy process.
We’ll talk about our journey with canvas in another article.
Summing it up
Apply the methods we used to find these improvements, by:
- Benchmarking quickly with fast feedback
This allows you to divide and conquer different parts of your code and eliminate what matters and what doesn’t. If you suspect a recent change has gone wrong, you can try changing it back.
In our case, we wanted to have results for each benchmark within a few minutes with just one button. Once it gets to be more than that, it becomes frustrating and progress becomes much slower.
- Deprioritizing less significant tasks during heavy processing tasks to increase efficiency
While scrolling, interactive cells were less important, so we made them intractable once the user finished scrolling.
- Researching events to the bottom
If there are any suspicious events, such as seeing that slower computers actually accomplished more(in our case, drawing more full interactive cells), follow your instincts, and research it.
- Perceived Performance
Performance is not all about numbers, it’s about experience as well
Challenge your product performance
Making a product faster is a never ending battle that can be very challenging. At monday.com, we’re always striving to create a better experience for our users.
If you share our passion for performance, feel free to contact us and tell us what you think!
Or if you have a question about what we do and want more in-depth information, we’d love to chat.