
What Your Selectors Are Doing When You’re Not Looking
So your application has a big memory footprint. You have a feeling that things could work better, but you have no idea where to look. Sound familiar?
That is exactly what we had: a complex application that we knew could behave better, but we didn’t know where to start. After all, performance and memory issues can be caused by many things – orphan event listeners, detached elements, and state management, to name a few.
Wait, what?! I can get why orphan event listeners and detached elements are a problem, but state management? That is a core part of the application!
Well, consider how many selectors you have defined, and how many times they are being executed. Sure, they use memoization, but your application might be storing too much (big memory footprint) or too little (big runtime footprint due to recalculations) – so which is it? And is there room for improvement?
You don’t know.
Do You Even Know What the Selectors are Doing?
We use Reselect v5, which introduced the weakMapMemoization technique. It basically means that the combiner function result is memoized based on the input selectors’ results, for as long as it has references. There is no limit to the list of results.
This sounds really good, right? I mean, if there are references to the result, it makes sense to store it in memory and not recalculate every render. And when it has no references, let the GC collect it to free up resources.
But here’s the thing you might miss:
Your selectors are being executed a lot of times.
Consider this example of a selector that is executed 1,000 times; let’s say 25% of those results are new and stored in memory. In most cases, these are not simple primitive values but an array of complex objects. This could mean a huge memory hit, which grows larger as complex applications with many selectors are used.
A paradigm shift?
You might say the solution is to use LRU memoization, but that is neither here nor there; what would be a good value for the LRU?
Too small, and there would be redundant selector recalculations that could have been memoized. Too big and obsolete, results that could have been cleared without references will remain in memory until pushed out by new ones. It cannot be a system-wide number… to be efficient, LRU needs to be defined per selector. But you don’t know.
In our case, the impact was huge: some slices were very big, and some selectors were misbehaving. We knew that, but we didn’t have a clue which ones, where to look, or how to improve. We had a huge blindspot.
We Had to Start Measuring
So one thing was clear. The first step was to get some insights. We had to shed some light on how we use selectors: collect metrics to identify misbehaving selectors and find the low-hanging fruit that will be fastest to fix and have the biggest impact.
So, we started with the oldest trick in the book: wrap and monkeypatch. We wrapped the original weakMapMemoize implementation and extended it by adding some extra logic to the result before returning it.
There were a lot of ‘gotcha moments’ along the way
- We basically added code that runs on every selector execution, so it had to be highly efficient, considering it was going to run 10K+ times.
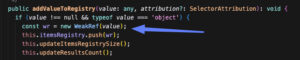
- We had to be super careful not to increase the reference count to results, as that would break the memoization – weakRef to the rescue!
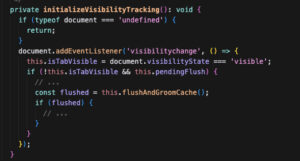
- We had to use advanced techniques like batch processing to postpone some of the heavy lifting until the tab is hidden, so the UX is not affected.
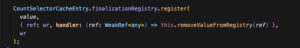
FinalizationRegistry to monitor GC
visibilitychange eventListener to offload heavy-lifting processing when the tab is hidden
- We even had to let go of one metric that was simply too costly to calculate and caused performance degradation to our users (I didn’t give up, though! Still looking for a more efficient way of collecting it using the same technique)
At the end of the day, even though it was a complex ‘touch-and-go’ effort that required delicate handling of what to collect and where, as well as when to do the heavy lifting, data processing, and reporting, we got what we wanted. A clear picture of what the selectors were doing, how often, and what the memory implications were.
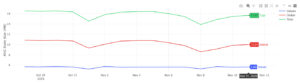
For each selector, we can now show how many times it executed, how many of those returned a new result, and how many results were collected by the GC. We have the results size for memory footprint, and how long it took the selector to execute (in ms) – min, max, avg, total – for the runtime footprint. And we can monitor them over time for regressions.
A note on attribution: having selector metrics data without being able to link to the specific selector, its slice, and what triggered it is very little help. We had to make changes to our MF architecture to accommodate this.
The Impact and Future Plans
Having these metrics collected is super powerful, as it allows us to define a semantic layer of selector profiles that describe behavior based on those metrics with pre-defined CTAs. So code owners now have visibility on the behavior of the selectors they own and that require attention.
We defined a few selector profiles based on: size|resultsCount|gcCount
Size > 100 in 10% of sessions is considered H
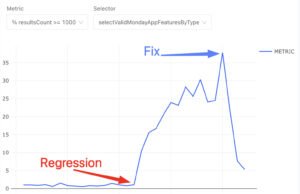
resultsCount > 1000 in 10% of sessions is considered H
gcCount > 1000 in 10% of sessions is considered H
So a selector with size 80, 1800 resultsCount and 1720 gcCount will be considered LHH.
LLL
These selectors have very small size, resultsCount, and gcCount values over time.
This profile suggests that it has a small number of values memoized that are rarely recalculated and GC collected.
It is considered a well-behaved selector.
HHL
These selectors have high to very high size and resultsCount values, and very low gcCount values.
This profile suggests that it has a large number of values memoized, but still they are rarely recalculated, and GC collected.
It might be a well-behaved selector that just stores a lot of data, but it also might mean that state size footprint could be improved by being less eager and fetching data on demand – so maybe it is actually not used correctly.
LHH
These selectors have low-to-medium size values and high-to-very-high resultsCount and gcCount.
This profile suggests that it recalculates new values too often, and that those values are then discarded without references and are thus collected by the GC often as well. So the long-term size might be low, but it has many redundant recalculations.
It will often be considered a poorly behaved selector that contributes to the runtime footprint and is a good candidate for further research on improvement.
HHH
These (very rare) selectors have very high size values as well as very high resultsCount and gcCount.
It is a combination of LHH and HHL, and most likely a bad-behaved selector and a good candidate for further research on improvement – size and runtime footprint.
On top of the profiles, having execution-time metrics as metadata adds an additional layer: a HHL selector with high execution times has a greater impact on UX.
The Impact
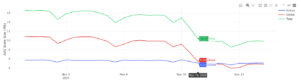
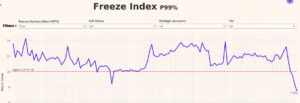
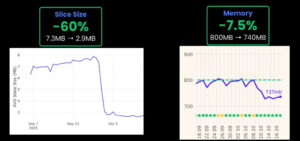
Using the collected information, we were able to identify an HHH use case that was not very obvious before and was hiding a design flaw that, after applying a fix, had a huge impact on key metrics (11% load time, 15% freeze index, 60% slice size, 7.5% memory)
In another case, we detected a regression in a specific selector behavior and fixed it before it had a big impact on users. Without these metrics, we would only become aware when users complained and would not have good visibility into the root cause.
Closing
For medium to large systems, the state management does a lot of work behind the scenes. Identifying inefficiencies and improving them might sound like nitpicking. Still, a very small performance improvement executed tens of thousands of times can add up to a substantial impact on the system as a whole.
This is true not only for state management; it is also only an example.
If you are in the dark, there is no way to find those opportunities, so when in doubt, invest in monitoring the performance of your codebase execution time and behaviors. That is the only way to find the big rocks, even if you have to break them down to pebbles.