
Unmasking a hidden singleton
Our race condition discovery
Every so often, a load test surfaces something truly interesting – and last week’s run on monday.com did exactly that. Dozens of simultaneous “Generate report” clicks against AI Reports – our feature that turns live dashboards into interactive, collaborative reports – unleashed a flood of baffling 400 responses.
Chasing that anomaly dragged us through multiple microservices, GraphQL mutations, and, ultimately, a sneaky singleton lurking in our codebase.
Here’s how we discovered it, why it remained hidden for so long, and what the episode taught us about testing and state management.
Setting the stage
If you’re new to monday.com, let me set the scene and walk you through dashboards and WorkDocs – two powerful building blocks at the heart of the monday WorkOS.
Dashboards
Dashboards let you pull data from multiple boards and visualize it in one place. Each dashboard is made of widgets, and every widget can spotlight a different slice of information, for example:
- KPI aggregations on charts
- upcoming meetings on a calendar
- project timelines on a Gantt view
- …and plenty more
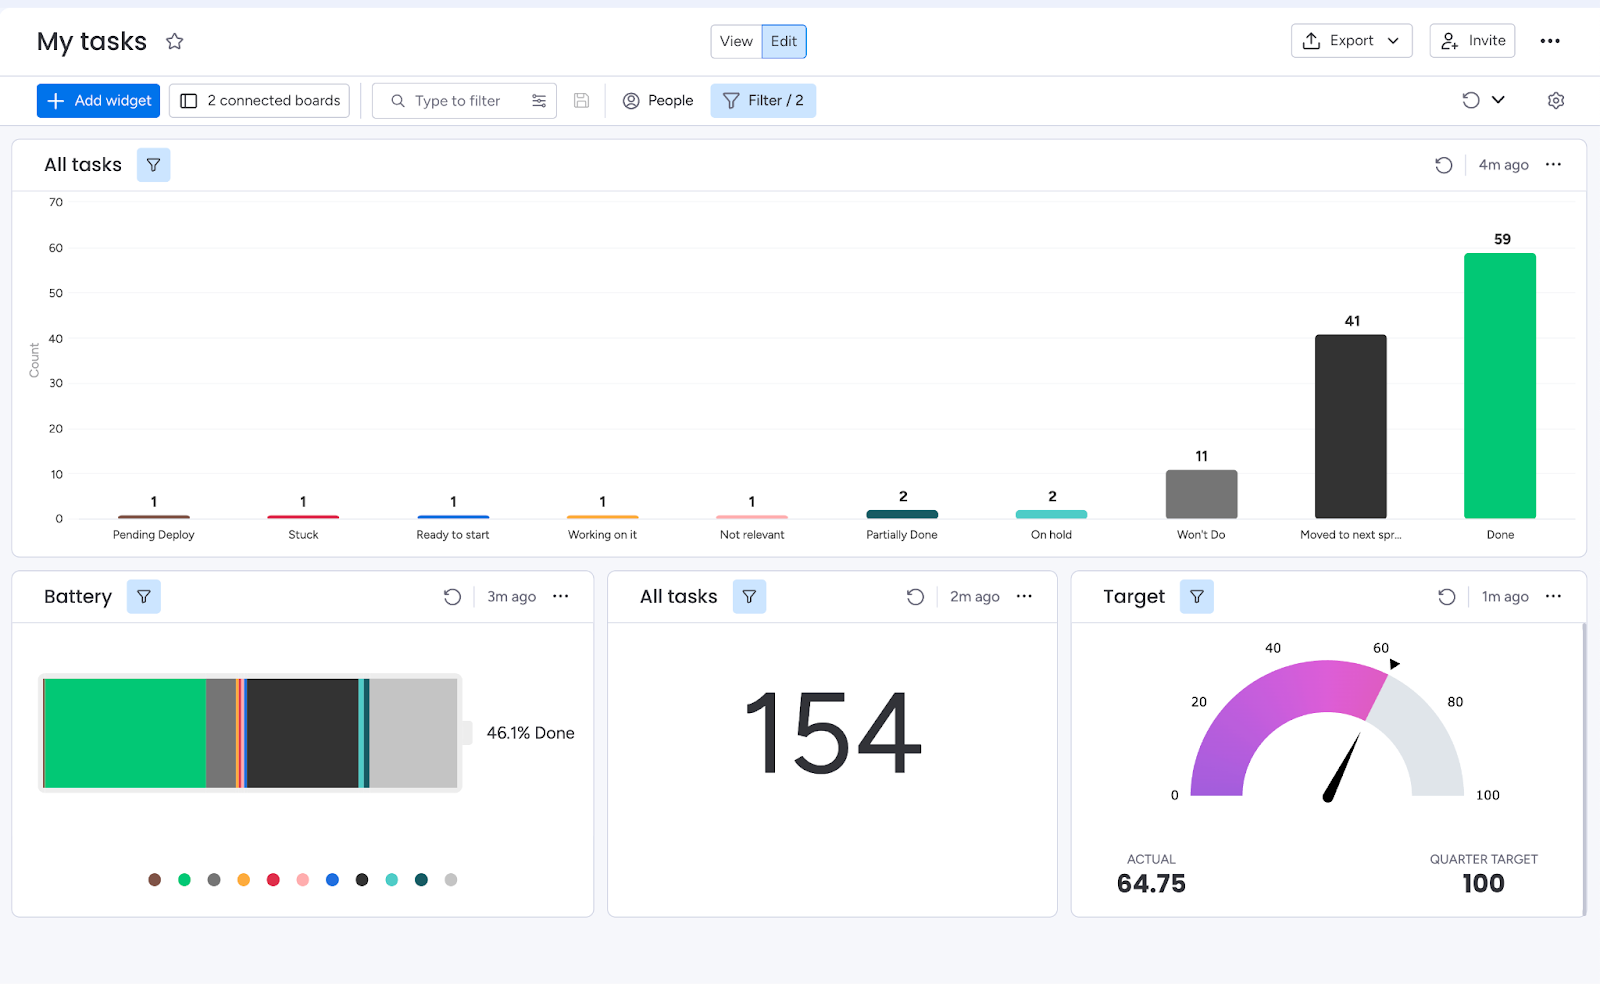
Here’s a sample dashboard:
Monday WorkDocs
WorkDocs are flexible, real-time documents where teams can write, plan, and discuss together. Because they’re linked to your boards and workflows, you can hop back and forth without ever switching tools.
A WorkDoc is built from blocks, and a block can be almost anything: a widget, an image, a video, a text paragraph, a heading – you name it.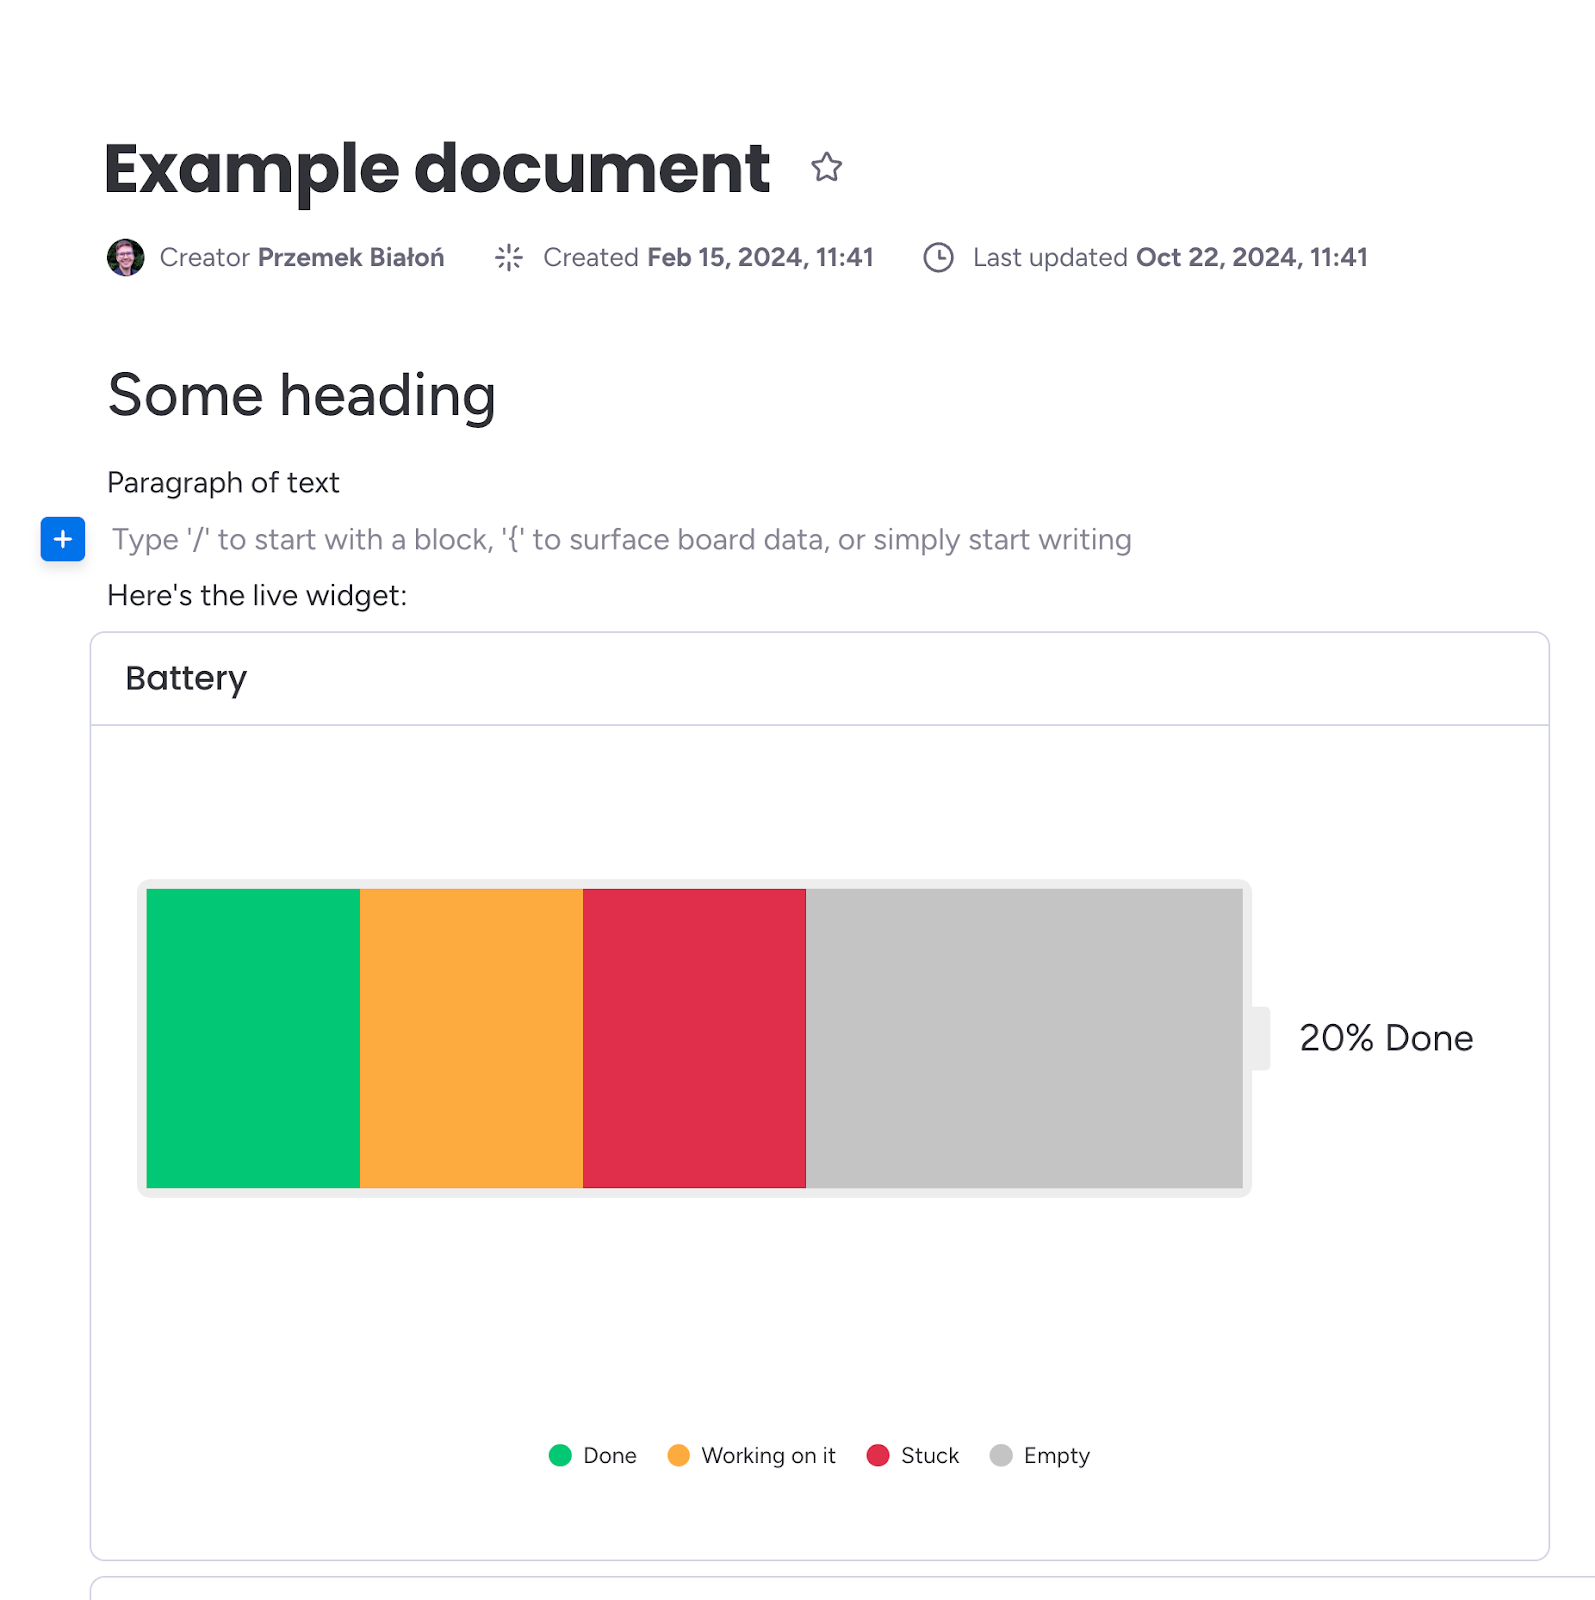
Monday WorkDocs exposes a GraphQL API that lets you manipulate documents programmatically – you can add blocks, insert images, and perform just about any CRUD operation you need.
AI reports
AI reports is monday.com’s new capability, exposing a one-click way to turn a live dashboard into a concise narrative you can share. Instead of manually copying charts, timelines, and metric snapshots into a workdoc, you press “Generate report” and let the platform do four things behind the scenes:
- Snapshot the dashboard – It captures a fresh image of every widget (charts, calendars, tables, etc.) so the report reflects the exact moment you clicked.
- Summarize with AI – Each screenshot, plus a bit of widget metadata, goes to an internal AI service that writes a summary.
- Compile a workdoc – Those summaries come back and are arranged – block by block – in a monday workdoc. Screenshots, headings, and AI text sit side by side, keeping visuals and commentary together.
- Deliver in seconds – The finished workdoc opens automatically, ready for you to tweak, share, or export.
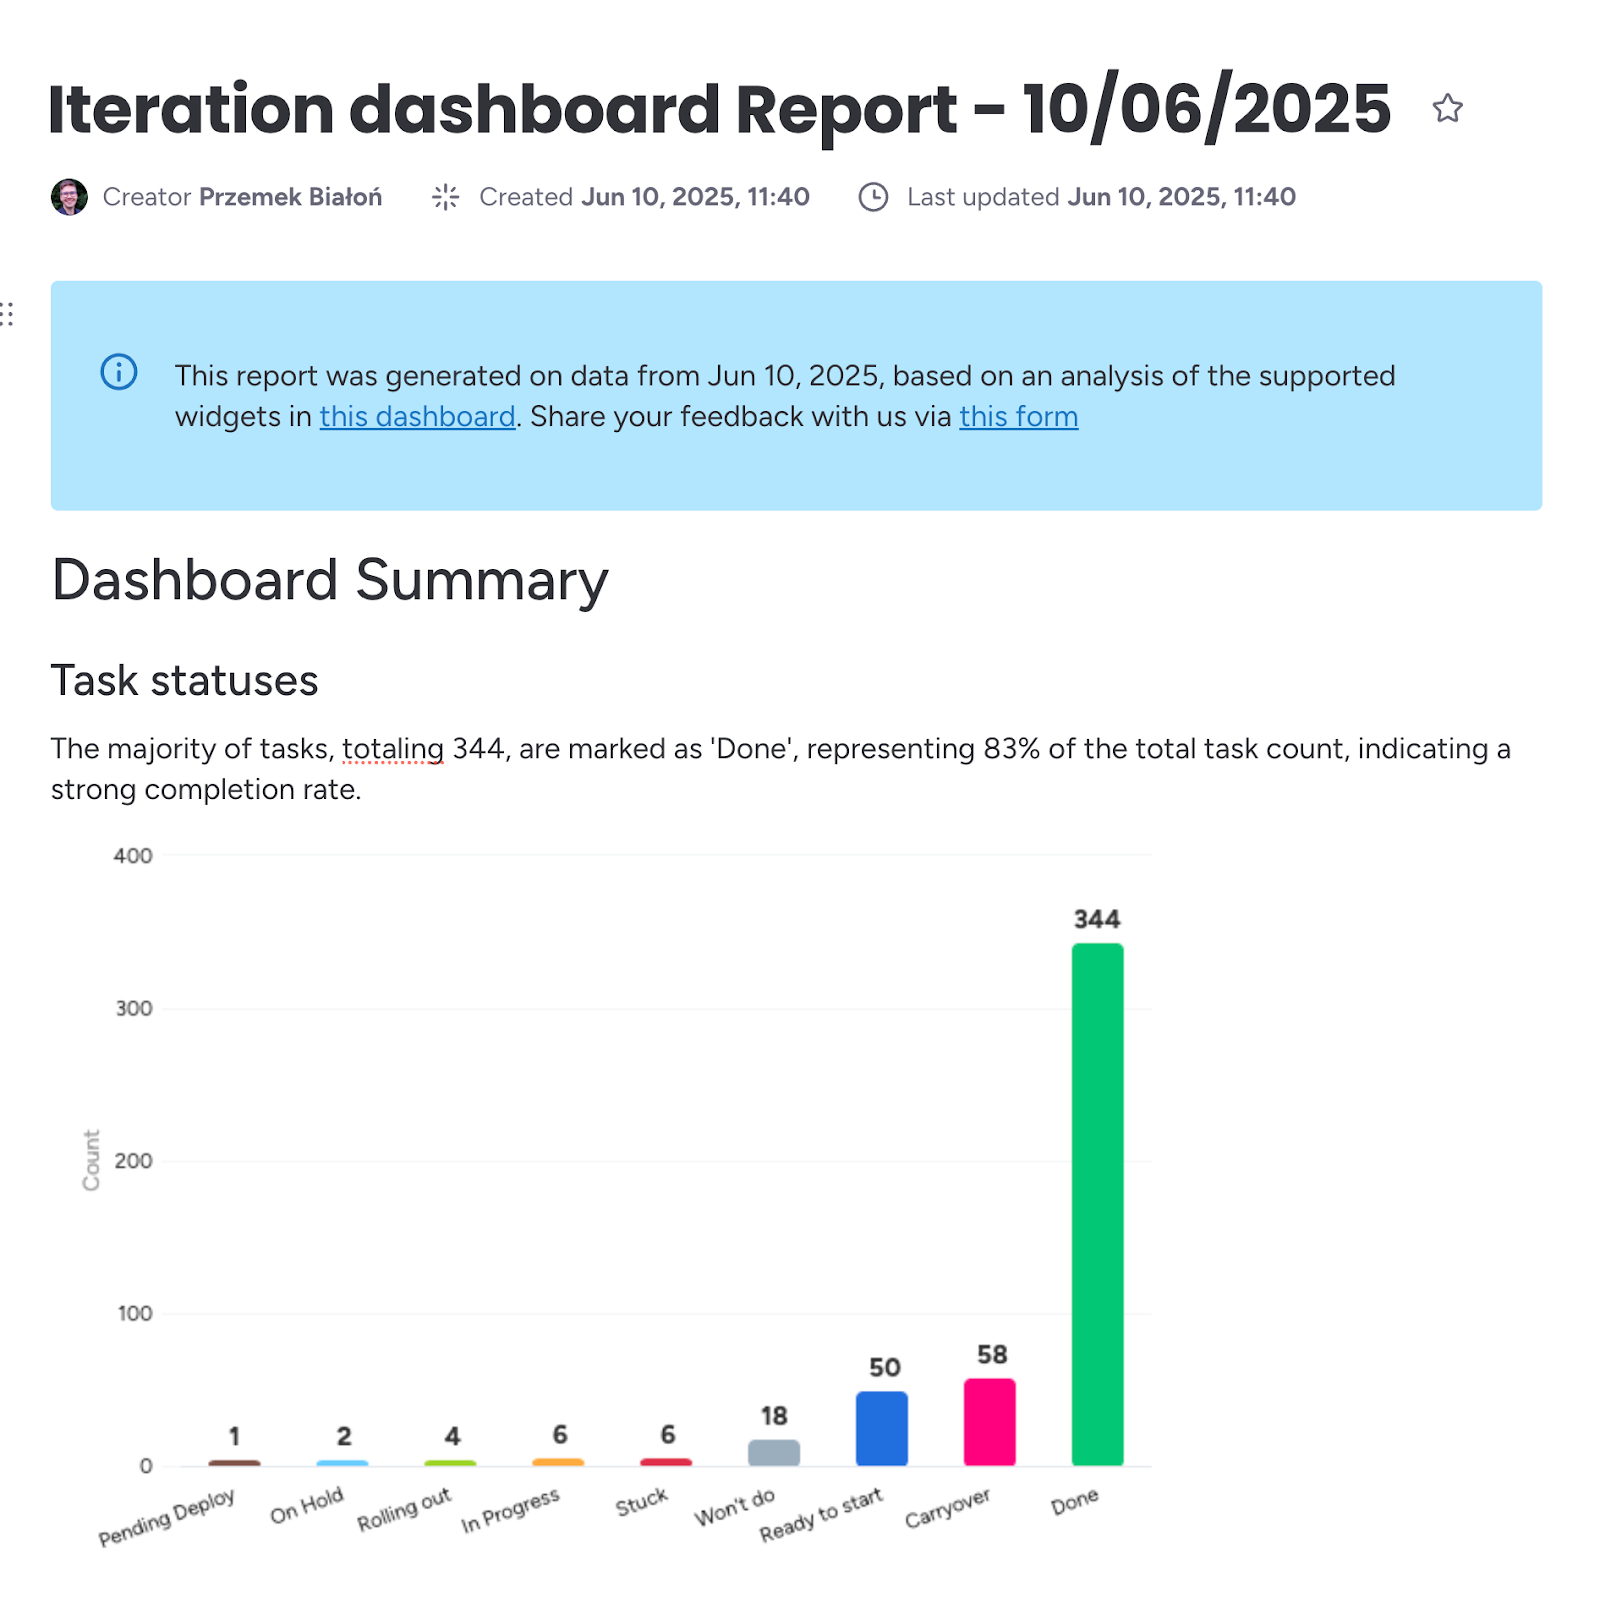
For team leads, it transforms a dashboard report that used to take thirty minutes into a single button click. For stakeholders, it adds clear context to raw numbers without ever leaving monday.com. Here’s an example report:
Load tests
To see how AI Reports behaves under real-world pressure, I turned to k6 and scripted a handful of load scenarios. Each scenario spun up to 16 concurrent virtual users who repeatedly clicked “Generate report” on a mix of light, medium, and heavy dashboards – containing from a couple of widgets to dozens. The test ran for a few minutes – long enough to cycle through hundreds of reports and let any hidden contention bubble to the surface.
At peak concurrency, things went sideways. We expected the downstream services – perhaps the WorkDocs API – to start throttling and return 429/500 errors, but none appeared. Instead, we were flooded with 400 Bad Request responses, suggesting the requests themselves were being rejected long before hitting those limits.
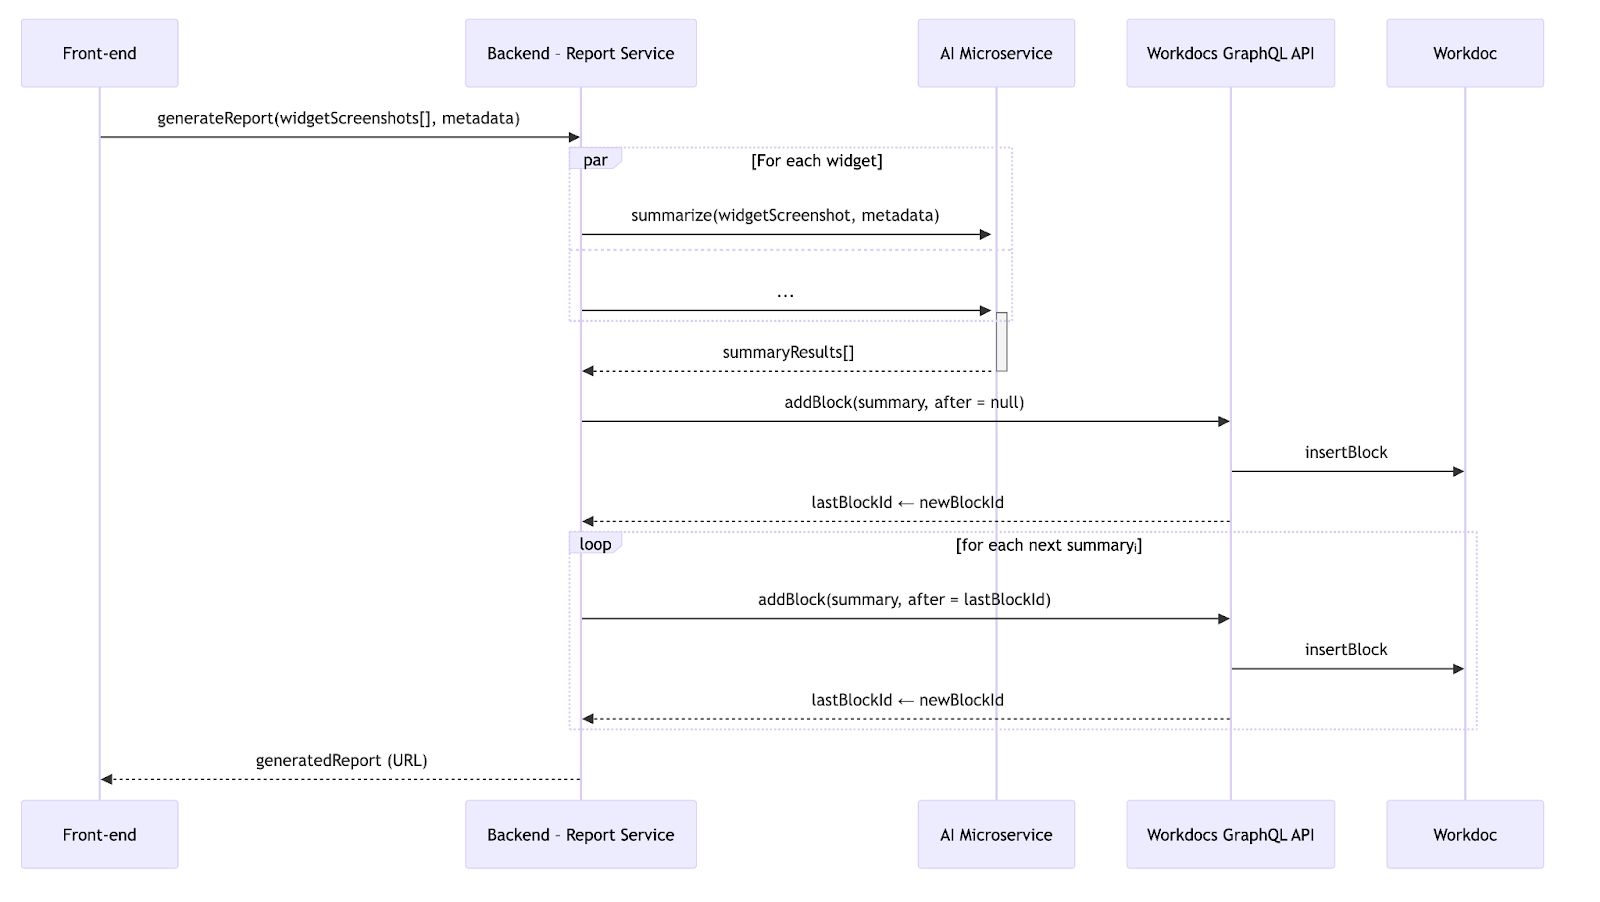
Behind AI reports: WorkDoc creation
With the big picture covered, let’s dive under the hood and walk through the request flow step by step. When the frontend sends widget screenshots plus metadata (title, type, etc.), we do three things:
- Fan-out to AI – we fire parallel requests to an internal AI microservice that returns a summary block per widget.
- Fan-in to WorkDocs – once every summary returns, we send GraphQL mutations to WorkDocs, adding the blocks one by one.
- Maintain order – we remember the last successful block ID and tell WorkDocs to insert the next block after it.
Here’s the flow diagram:
Armed with that mental model, let’s go back to the load test logs.
The smoking gun
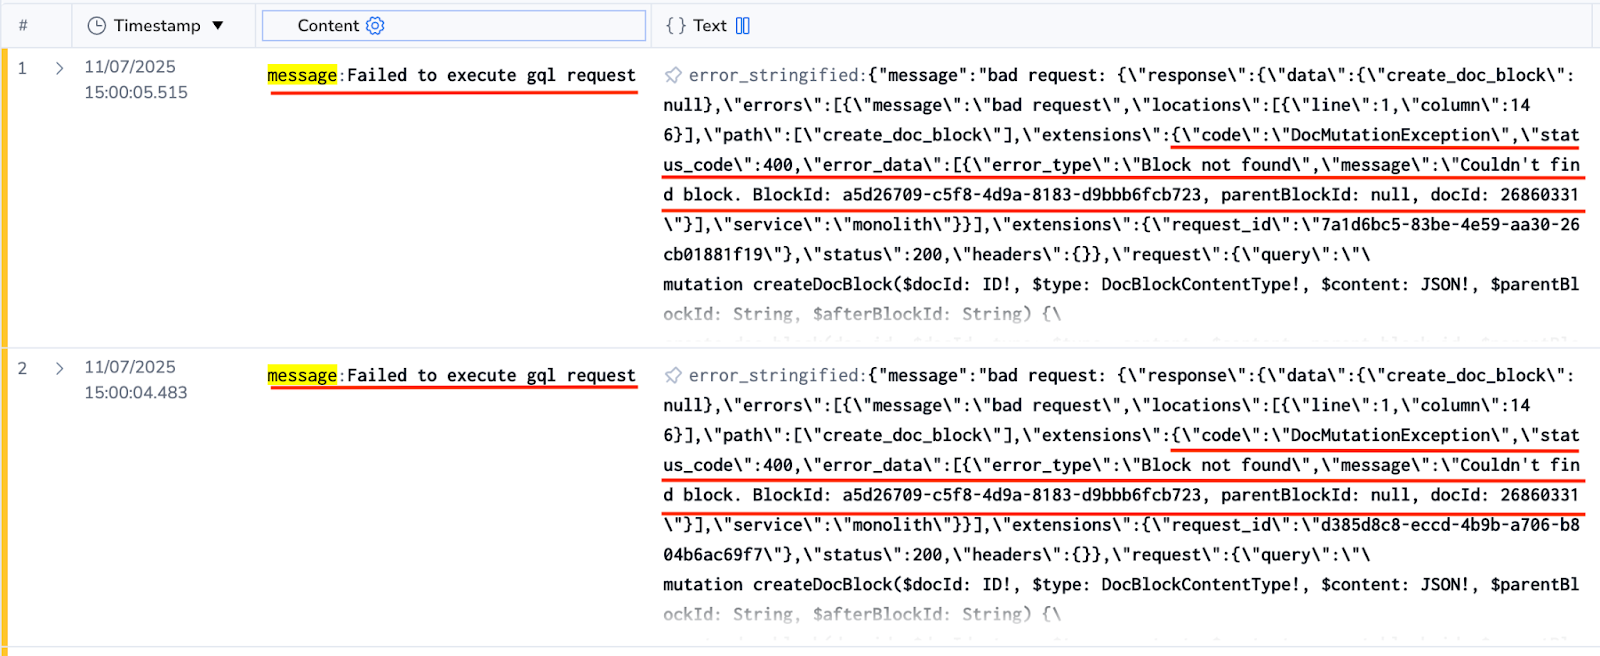
The WorkDocs microservice consistently returned errors:
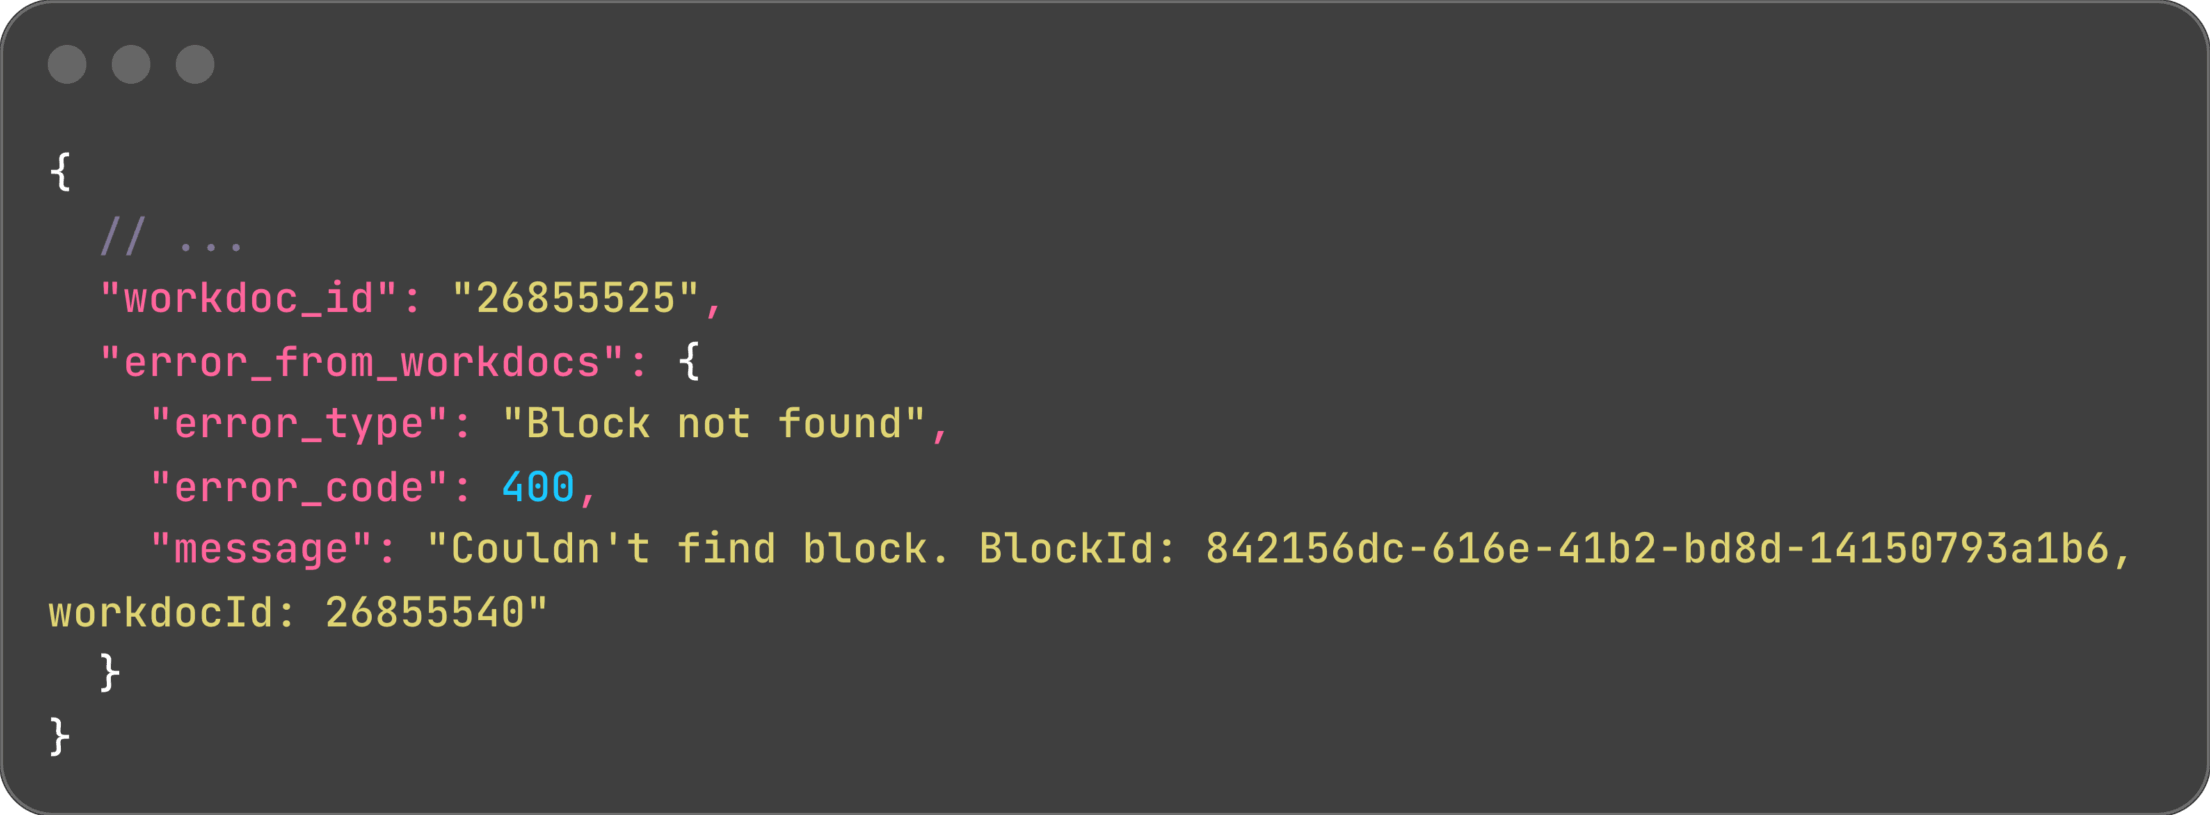
But the outer log line said workdoc_id: 26855525. The inner one – workdocId: 26855540. Two different WorkDoc IDs in the same request – what?
It clearly wasn’t random bit-flips. Every 400 showed the mismatch. Time to dig in!
Rabbit holes, dead ends, and the “aha!”
Hypothesis 1 – observability context is leaking
We may have cached the wrong context, and only the logs were wrong.
SavingReportService carries an observabilityContext: 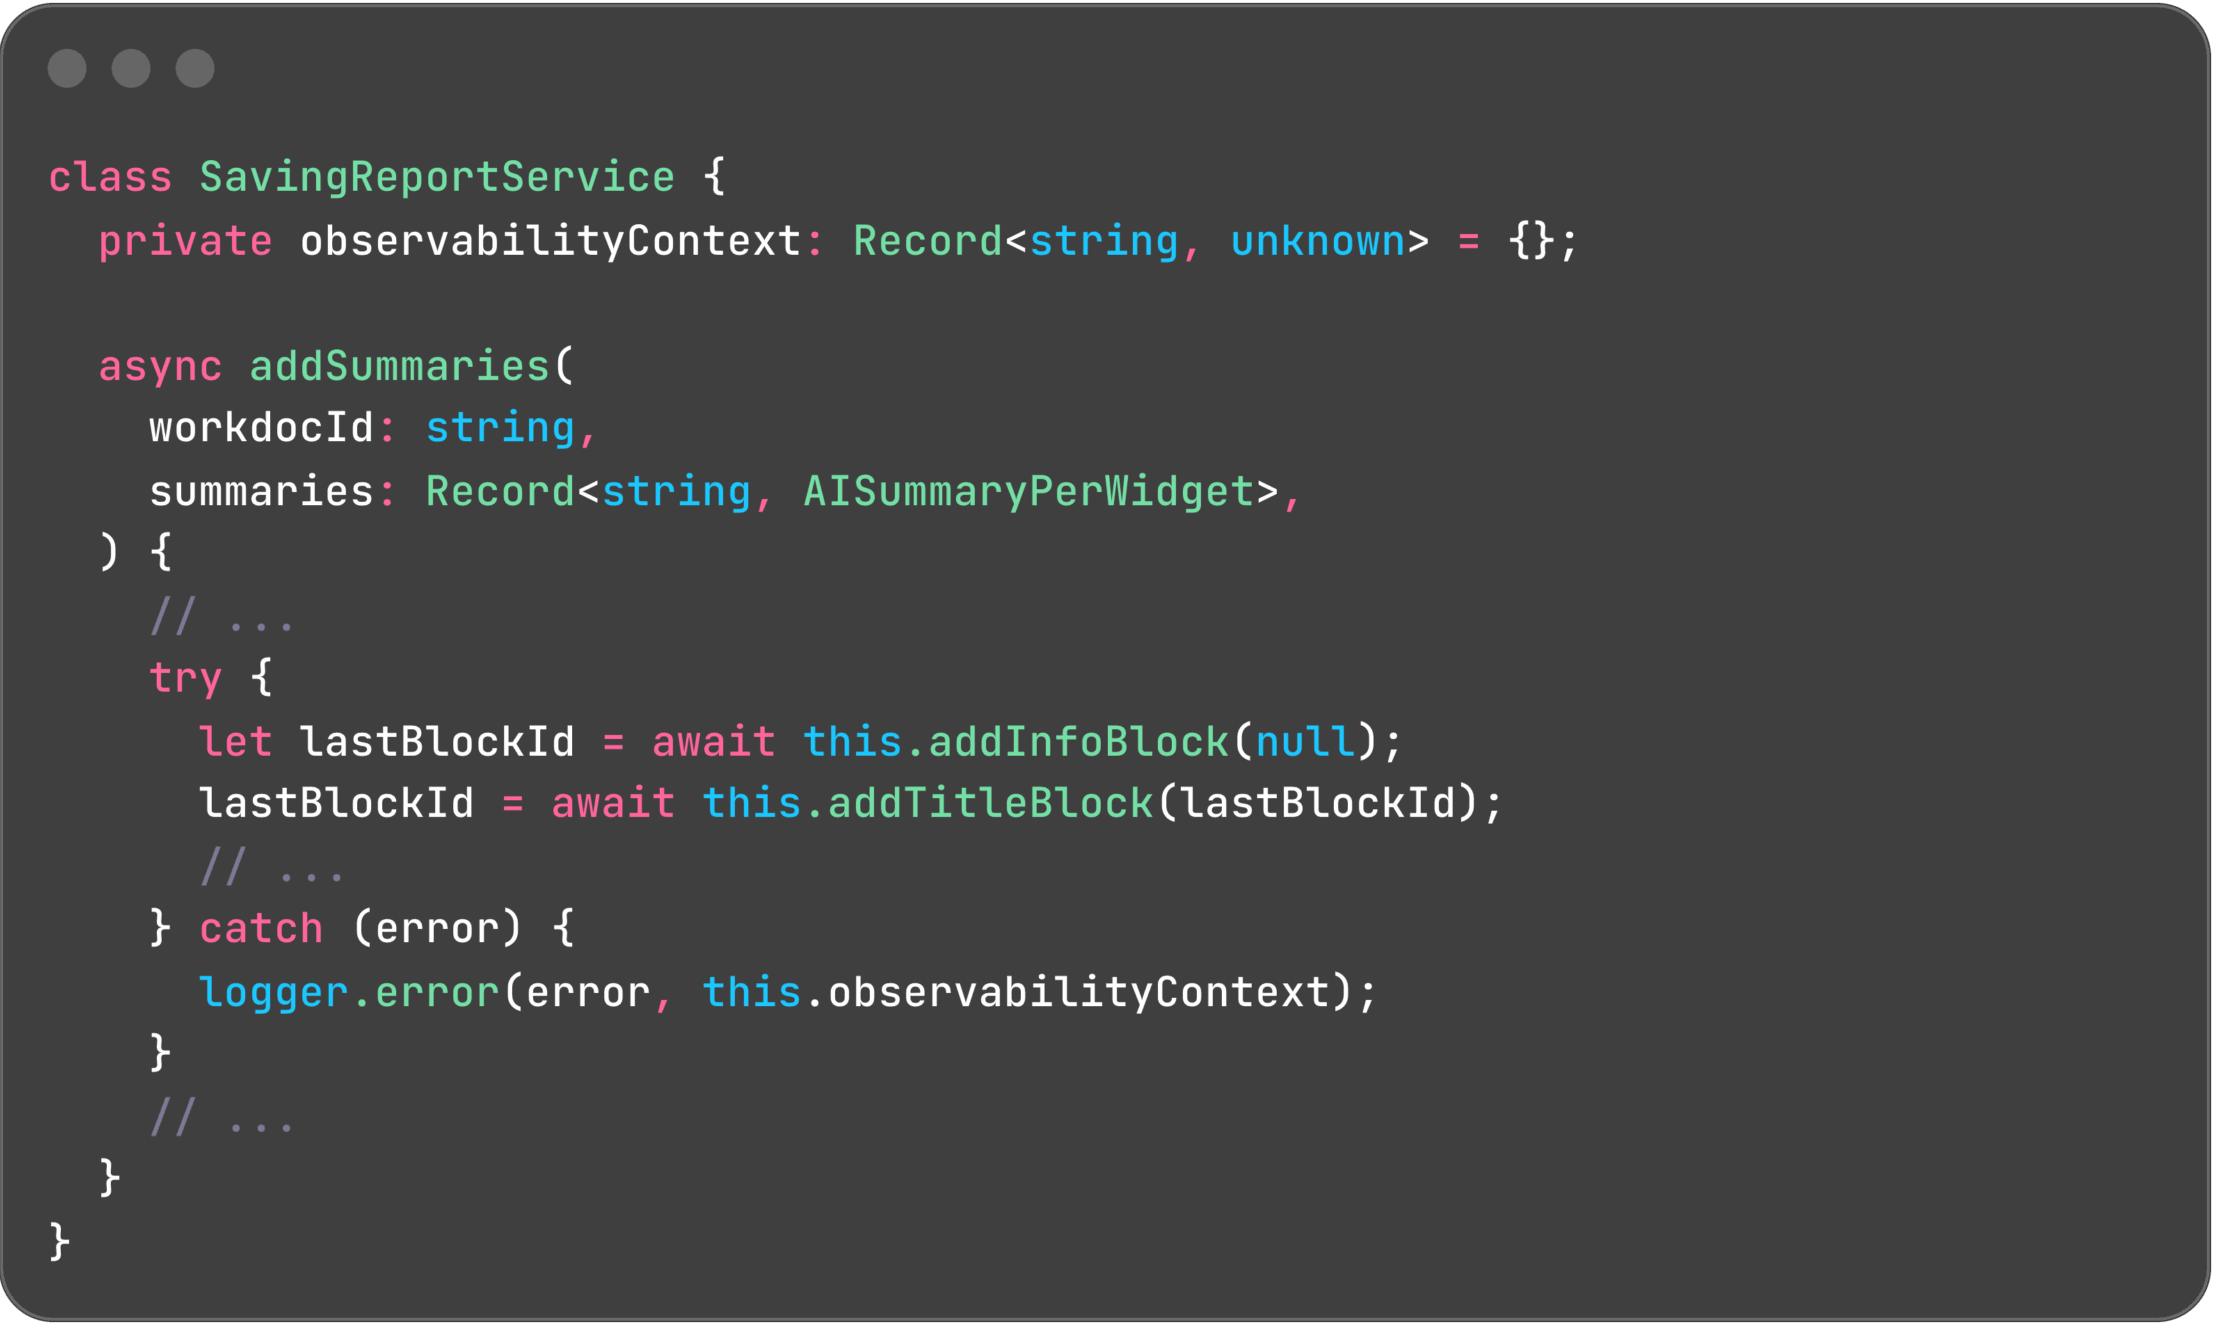
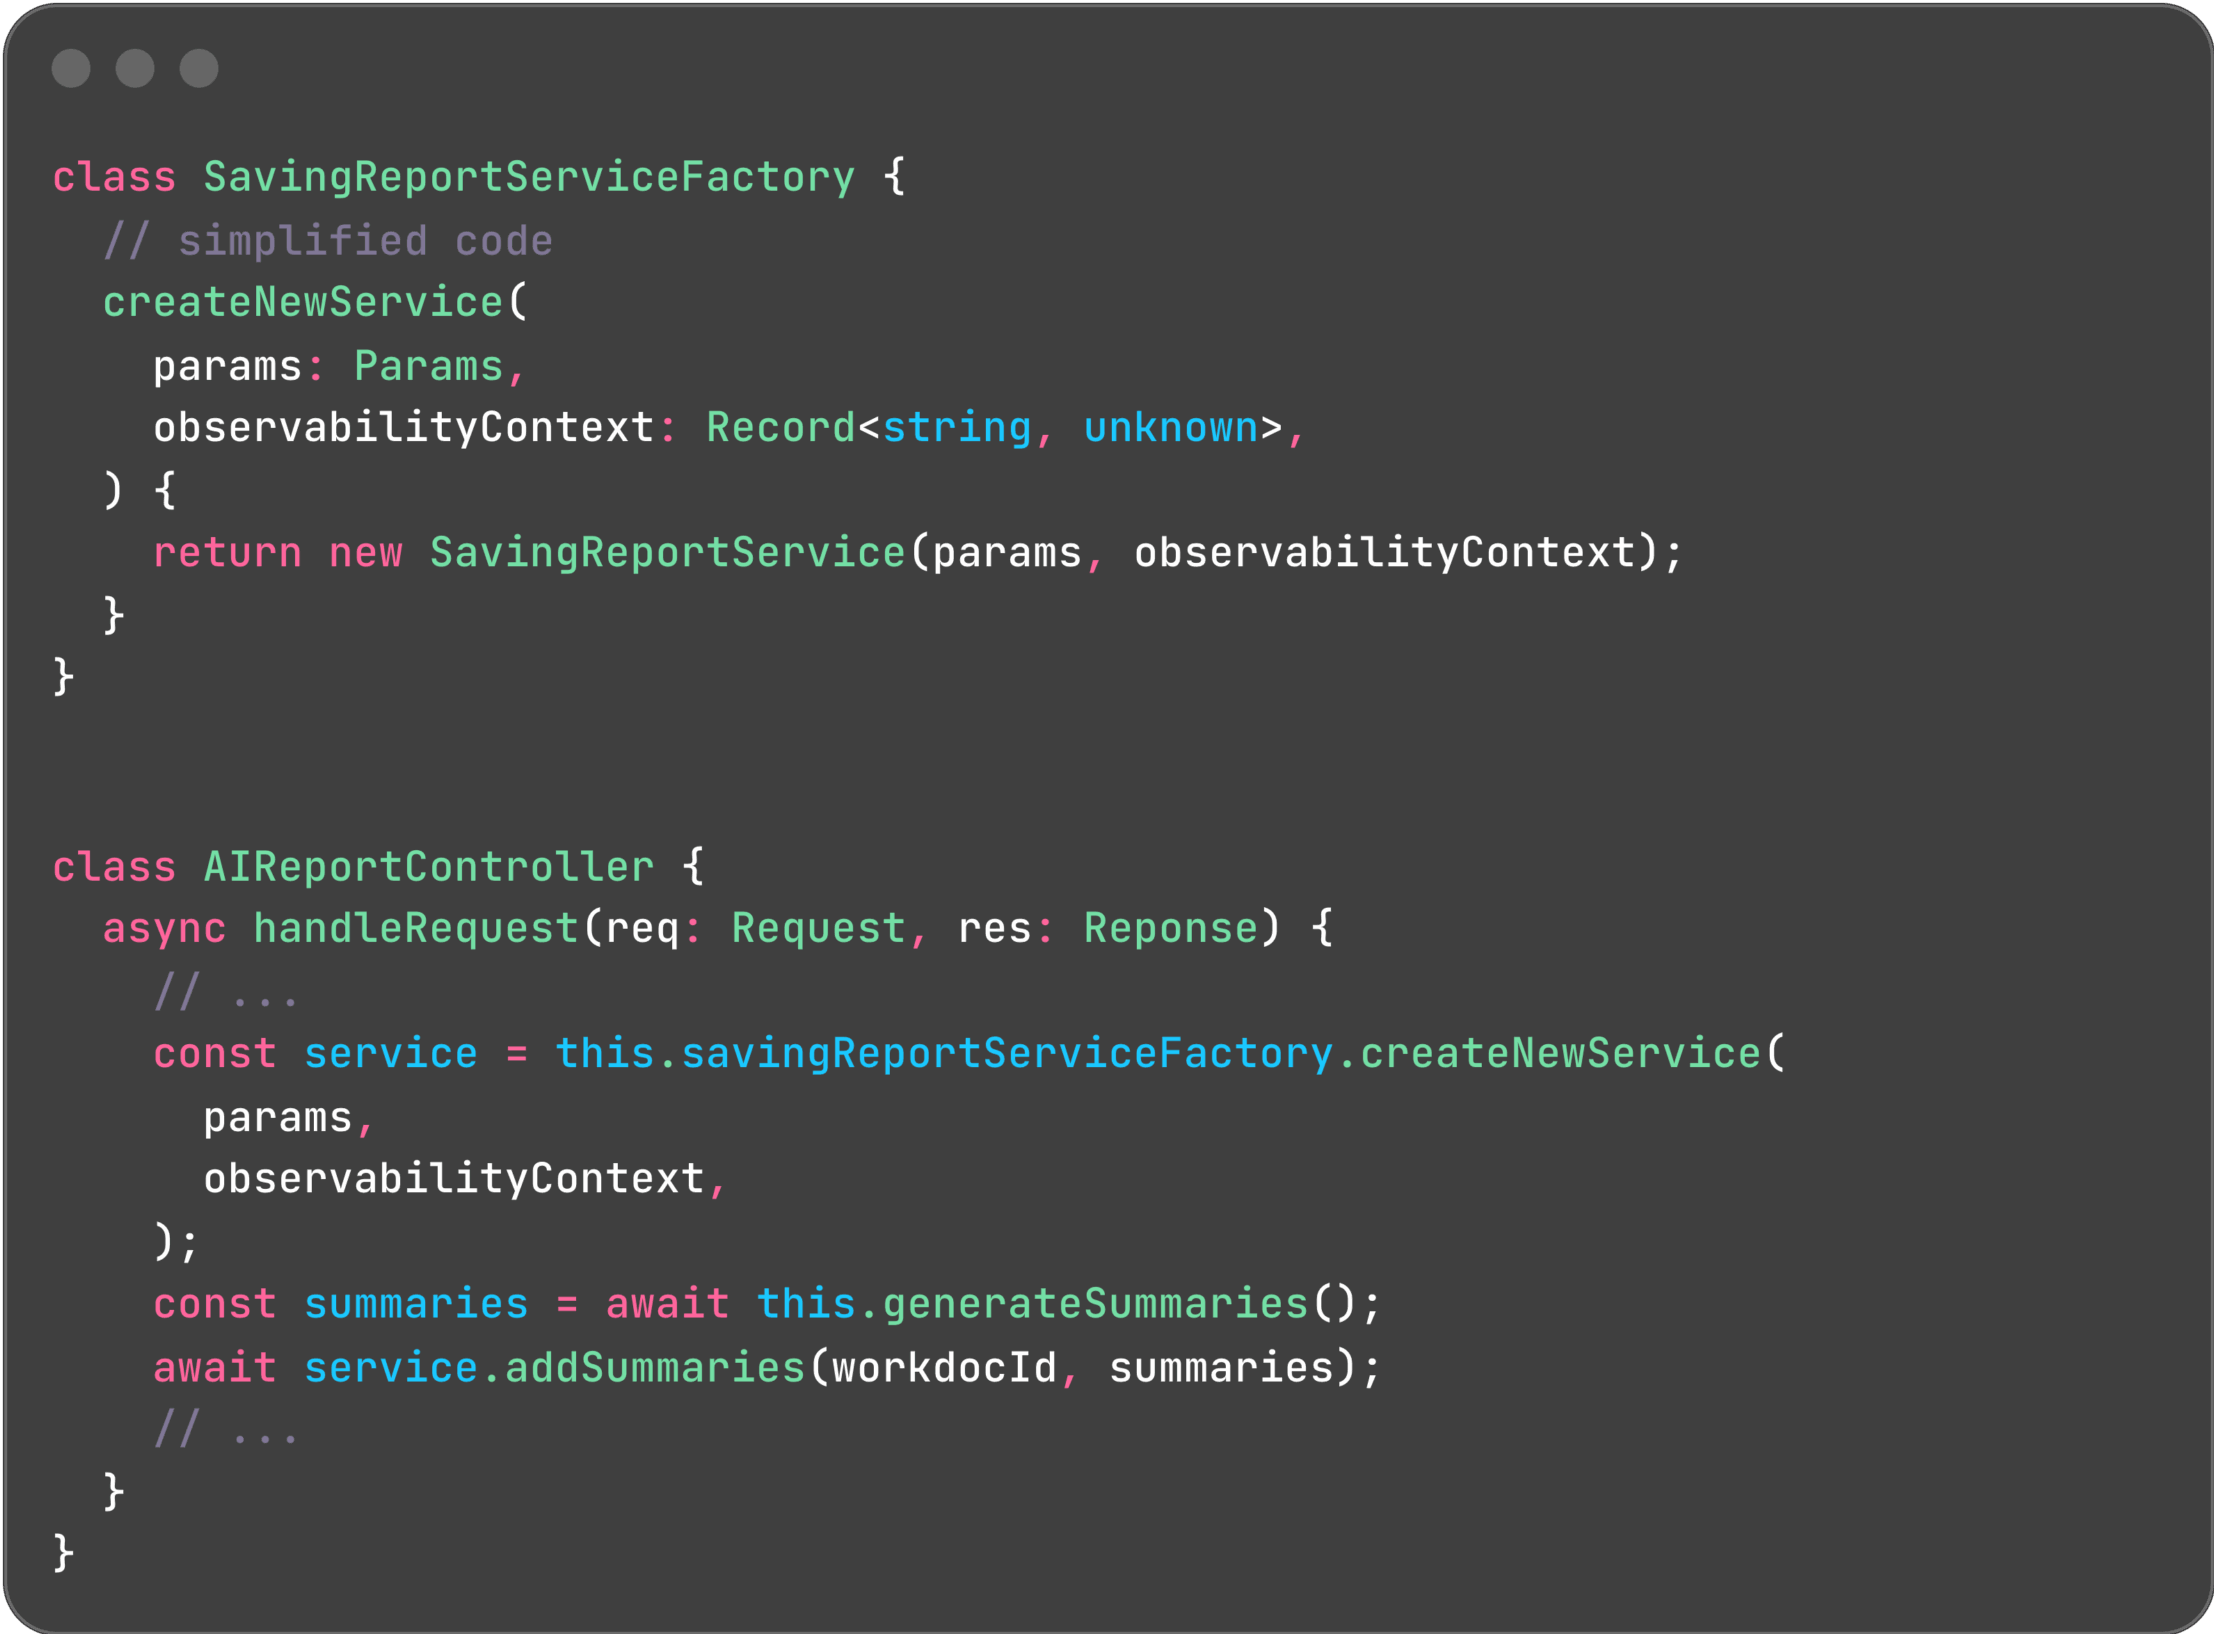
However, each request receives its own SavingReportService instance, created using a factory pattern, thereby ruling out context leakage:
Hypothesis 2 – corrupt lastBlockId
To maintain the correct block order, we track the last successful block ID and include this in the GraphQL request. This instructs the WorkDocs API to insert a new block immediately after the existing one. This exact error, as seen in the logs, would occur if the specified block does not exist.
However, we have verified that the block ID is updated correctly. Failed mutations are retried up to three times, and we fall back to the previous good block if necessary.
Aha! – hidden singleton!
If the per-request state is bleeding between requests, and we do not share any global state, then one of our classes must be a singleton. SavingReportService wasn’t, so that left WorkdocsAPIService.
Sure enough! We register WorkdocsAPIService as a singleton, instructing the container to create a single instance of the class and inject that same instance whenever WorkdocsAPIService is requested.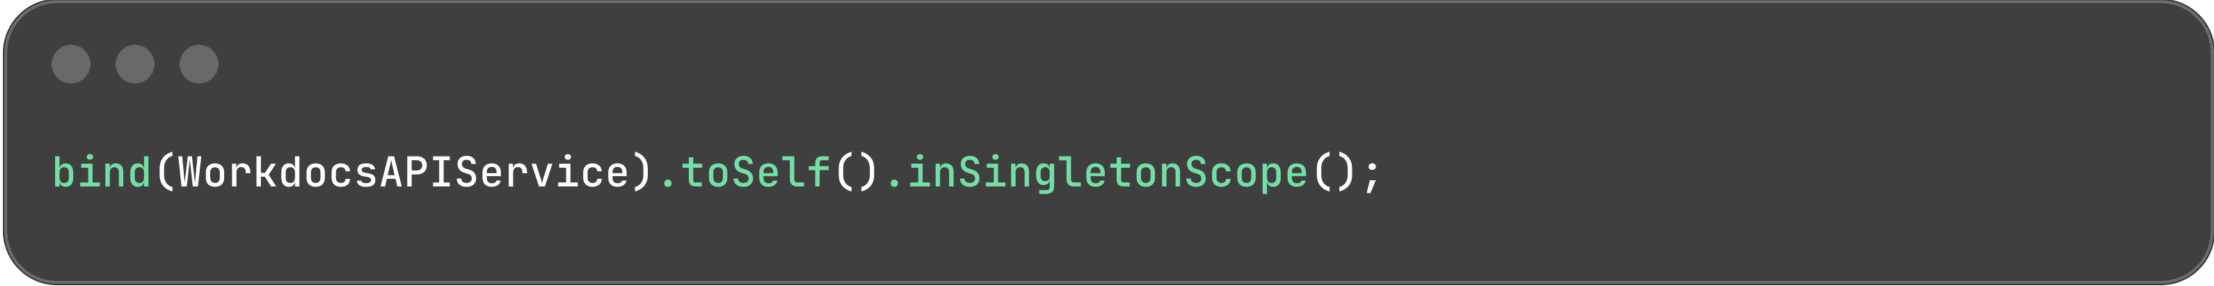
Copy-and-paste strikes again. All the other services in this module were stateless, so registering them as singletons made perfect sense. But WorkdocsAPIService wasn’t stateless – and that subtle difference slipped through.
The result? Every pod kept exactly one WorkdocsAPIService, so concurrent reports overrode each other’s workdocId.
Why didn’t we see this sooner?
- Low adoption. We only generate ~200 reports/day (up to ~15–20 per hour).
- Lots of pods. To deliver faster, we reused an existing microservice, which scales to ~60 pods at peak. The odds of two reports landing on the same pod were tiny – until our load test slammed dozens of requests at once.
Takeways
- Have an E2E test that hits the same instance with at least two concurrent users.
- Load testing is priceless. We wanted headroom data and got a critical bug fix before users felt it.
- Prefer stateless classes. Mutable state plus async == pain. We can’t ditch async, but we can ditch the hidden state.
Happy bug-hunting!