
Fueling the AI SRE: How monday.com Standardized Observability for 600+ Services

You spent the last two months developing a new service, got all the approvals on your architecture design, and you’re ready to deploy to production.
There’s one last checkbox you need to fill: Observability.
It’s a small service, more of a helper, nothing critical. You spend a day setting CPU and memory alerts, and maybe an error-rate alert for the one endpoint you have.
Thresholds? Whatever felt right at the moment.
Runbook? I know my service; everybody knows how to deal with a CPU throttling alert.
I’ll add more monitors as it scales up.
Two years later, the service has served half of the production traffic, six other services depend on it, and you’ve never looked back at the alerting setup. In fact, you don’t even work there. You just started your first on-call rotation at your new company. And the very first night, you get the proverbial 3 AM page. You stare at a high-severity alert for an unfamiliar, business-critical service. You click the link. The dashboard is broken. You check for a runbook. There isn’t one. You search Slack, only to find a thread from two years ago written by an engineer who left the company last month, saying: “I know my service; everybody knows how to deal with a CPU throttling alert.”
We’ve all been there, cursing our predecessors.
Scaling the Nightmare to 600+ services
At a small startup, this is a minor annoyance. At monday.com’s scale, managing this operational noise becomes critical to maintaining a seamless experience for millions of users.
Our engineering culture focuses on giving engineers the freedom to choose the tools they use and how they use them to build the best Work OS platform. The observability tooling is no exception.
We structure our observability tooling around OpenTelemetry instrumentation, giving us the liberty to choose from a range of observability and monitoring platforms. As a result of this freedom, our Observability team currently supports 10 different tools and vendors. When you let hundreds of developers manually configure their own observability across ten different tools, a few critical things break down at scale:
- The Wall of Noise: When thresholds are set based on “whatever feels right at the moment,” you get chaos. One team alerts at 70% CPU; another alerts at 95%. On-call engineers can easily face alert fatigue, making it harder to quickly isolate and prioritize critical signals.
- The Tribal Knowledge Abyss: Runbooks become a myth. They are scattered across obsolete documentation sites, Slack messages, or, worst of all, locked entirely inside the brains of engineers who have long since switched teams or left the company.
Why Good Observability is Hard
This friction doesn’t exist because the engineers are lazy (well, we are, but that’s what makes us well-suited for the job), but because observability is objectively hard to do right. It requires experience, deep infrastructure knowledge, and most importantly, time. When a team is pushing to ship a new feature, you can’t expect them to pause for a week to architect a flawless, future-proof alerting system from scratch.
But you still need it to be done right.
To break the cycle, we realized we couldn’t just tell engineers to “do better”. We needed a common, extensible framework that allows everyone to quickly set up standardized alerting for any service, new and old.
Because when you strip away the business logic, the services are not actually that different from one another:
- The Baseline: Every single one of them needs a similar baseline of alerts on low-level signals. Everyone wants to know whether they’re approaching CPU or memory limits or whether their containers are stuck in a restart loop.
- The Dependencies: Depending on the other resources they use, such as queues, databases, and caches, the services need another set of alerts with a common structure, even if the specific thresholds differ.
- The Custom Logic: Only after those layers are solid should the service owners start thinking about custom alerts for their services’ specific use cases.
The engineers shouldn’t be bothered with discovering the intricacies of our infrastructure to create a basic CPU alert and recreating the same runbook as every other team.
Food for AI SRE Agents
Beyond helping our human engineers, standardized alerts are crucial for the era of AI SRE Agents. Standardized alerts serve as a predictable data contract, providing AI agents with the precise context they need to operate.
- Zero Noise Correlation: Instead of forcing an AI to correlate between hundreds of subtly different, messy custom alerts that ultimately achieve the same goal, it gets a clean, unified signal.
- Tribal Knowledge Turned Institutional: Because the alert structure is uniform, the AI can instantly recall past incidents triggered by the exact same alert, matching the current issue with the specific “chain of thought” used to resolve it in the past.
So, instead of asking every team to reinvent observability, we decided to build a single platform to meet all observability needs. And what better place to house it than Sphera, our Internal Developer Portal? (If you’re curious about how Sphera came to be, you can read about our journey to create an IDP here).
Meet the Observability Guard
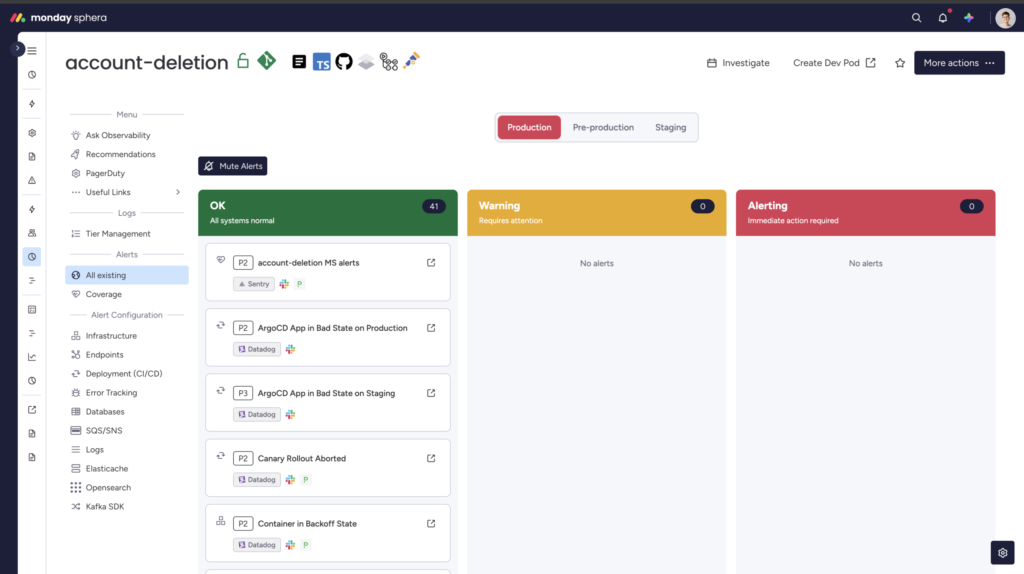
What we proudly call the Observability Guard is, in fact, yet another tab on the service page in Sphera. Its goal is to provide a single point of entry for all of the team’s observability needs. What started modestly as a templating engine today handles service metadata in our providers, manages storage tiers for our logs, proposes infrastructure changes, and enforces mandatory alerts. Let’s start with the basics: alerts.
Alert Templates
Everyone has some basic idea of what monitors every service needs. That knowledge grows with engineering experience, and we want to share it with everyone at monday.com. So we started with what our team knew best about alerting best practices, focusing on the Kubernetes infrastructure: pod and ArgoCD app status, resource usage, HPA approaching limits, and CronJob issues. To me, the default alerts provided by the kube-prometheus-stack always served as a good starting point.
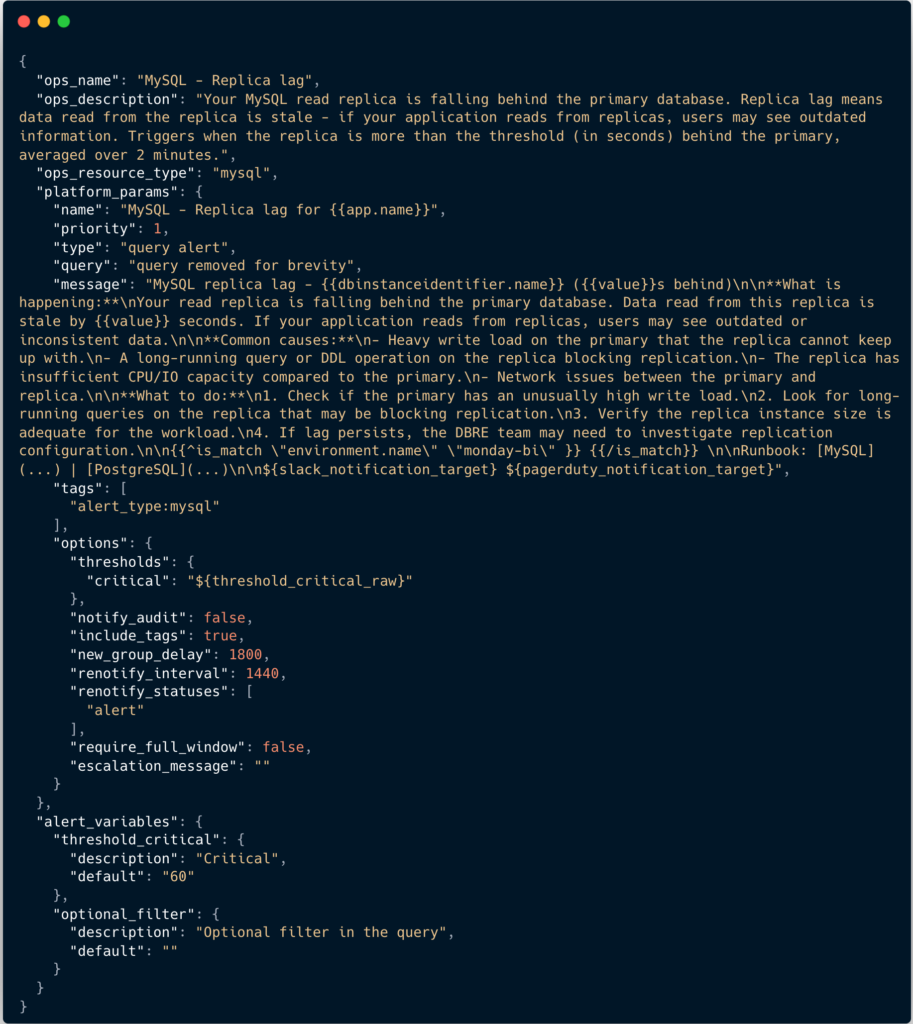
But our knowledge is limited, so we wanted to invite other teams to support this initiative. We needed a way to allow easy collaboration, so we decided to store the alert definitions as JSON templates in the Observability Guard git repository. Everyone at monday.com has access to this repo and can contribute. The biggest contributors, naturally, are the teams closest to the production infrastructure: Production Engineering and Database Reliability Engineering. The product development teams, being on the receiving end of the alerts, mostly contribute to the quality of the alerts by enhancing runbooks, managing grouping, and configuring filters.
By fostering a sense of common ownership, we built an impressive catalog of 107 alert templates.
Resource Discovery
One generic alert for all your pods might be enough, but your endpoints or queues will certainly need more flexibility.
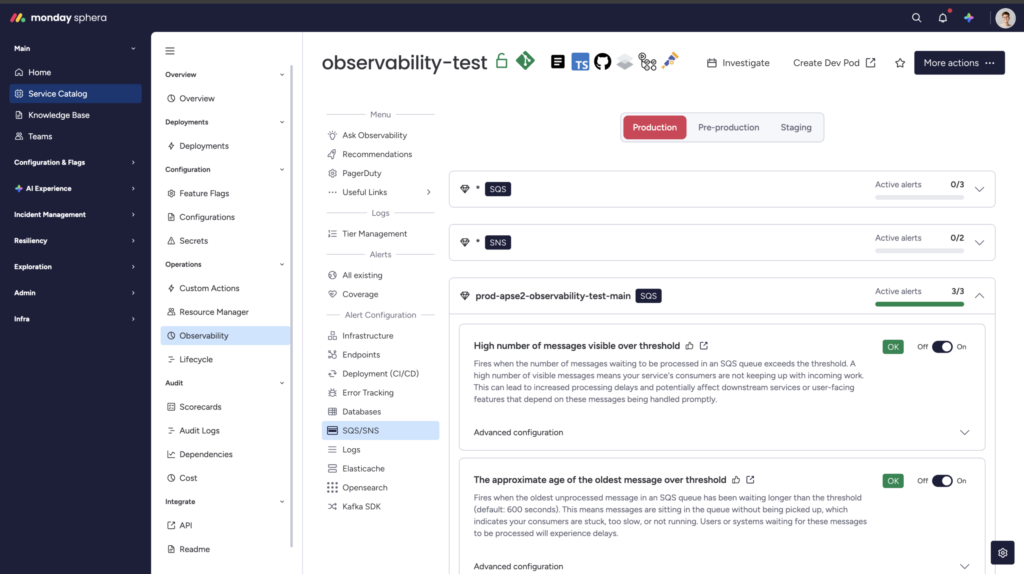
We started simple: a single blanket alert for all SQS queues. The flaw? A one-size-fits-all threshold only protects your largest queue. If a smaller queue backed up, it would never cross that high threshold, leaving localized anomalies undetected by the blanket rule.
To solve this, we used our internal cloud inventory service to build automated resource discovery. Here is how the functionality works now:
- The Blanket Default: We keep things simple with a broad wildcard alert. It catches all your queues under a single, standard baseline rule.
- Smart Overrides: If an engineer needs a custom threshold for a specific queue, they can set it. The system automatically applies the new rule and excludes that specific queue from the blanket alert so they don’t get double-alerted.
Stop the Guesswork
How do you determine the correct alerting threshold? You have to find a precise point, balancing between being woken up at night and missing the incident. It’s an art form in itself.
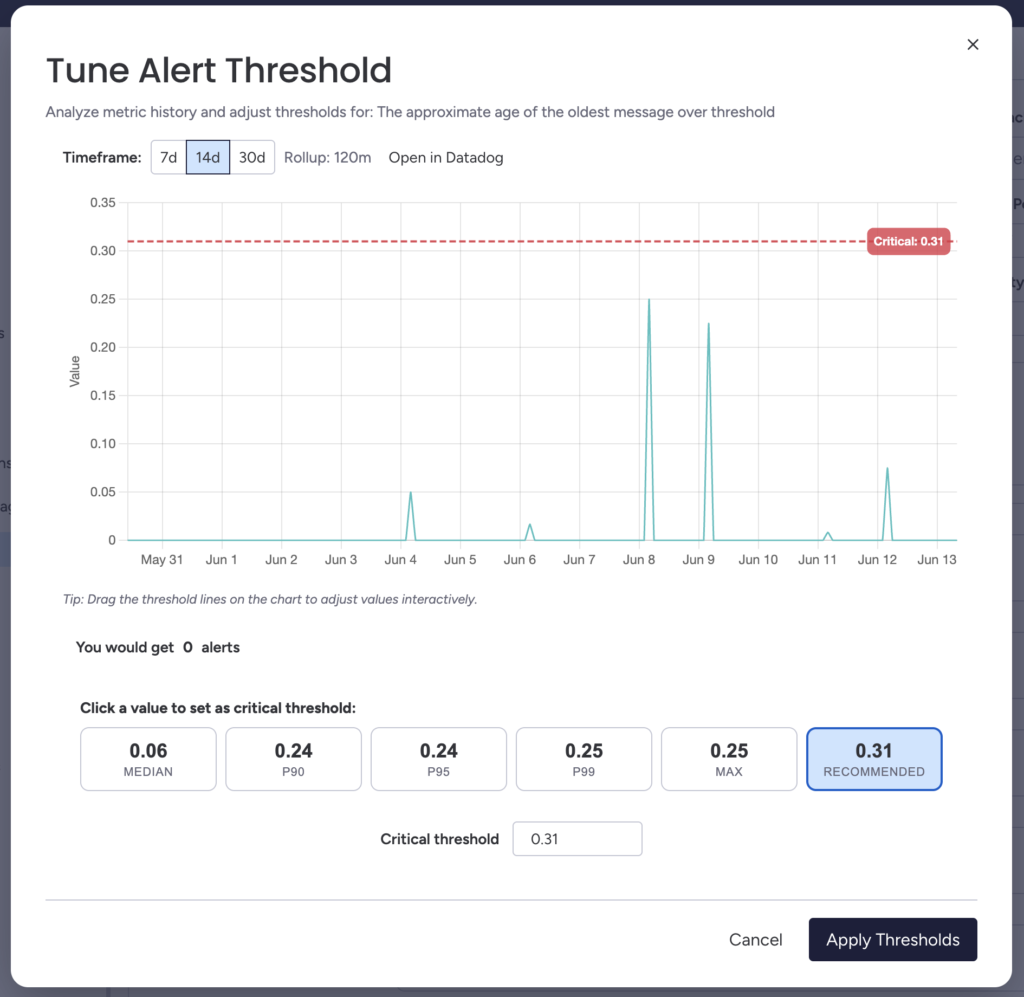
Observability Guard analyzes the metric’s past behavior and automatically proposes a fitting threshold. Our go-to method is Median Absolute Deviation (MAD).
Why MAD? Traditional standard deviation is easily skewed by wild, temporary anomalies; a single massive spike can ruin your baseline. MAD is more robust against outliers because it focuses on the median, giving a much truer reflection of normal behavior. The algorithm calculates thresholds in three steps:
- Find the Baseline: It calculates the median metric value over a set timeframe (default: 14 days).
- Calculate the Variance: It measures how far each data point deviates from that baseline and finds the median of those deviations.
- Set the Alert Thresholds: It establishes thresholds using a basic multiplier: k*MAD, where k=3 for warnings and k=5 for critical alerts.
Of course, no algorithm knows your code better than your engineers. We strongly encourage teams to override the defaults and set custom thresholds whenever they have specific domain knowledge.
To aid them in crafting those custom thresholds, the tool exposes the MAD calculation in a clean graphical interface, alongside other key historical data points like max, median, and percentiles. All in a graphical interface.
It’s also available as an AI skill for those who don’t believe in clicking on the Web anymore.
Log Management
While managing alerts saved our engineers time, we realized the Guard could also tackle another massive data headache: dynamic log management.
Every person who has to manage logging platforms knows this pain. Your log quota is running out, and you have to find someone to sacrifice their logs for the greater good. You found somebody? Great, now they need to change the log level or tags in the code and deploy it, or, if you’re using a log gateway, make that change there.
This is exactly the kind of manual, low-level infrastructure friction Observability Guard was built to remove. Instead of forcing teams to manually refactor code just to manage data volume, we built log management directly into Guard’s capabilities.
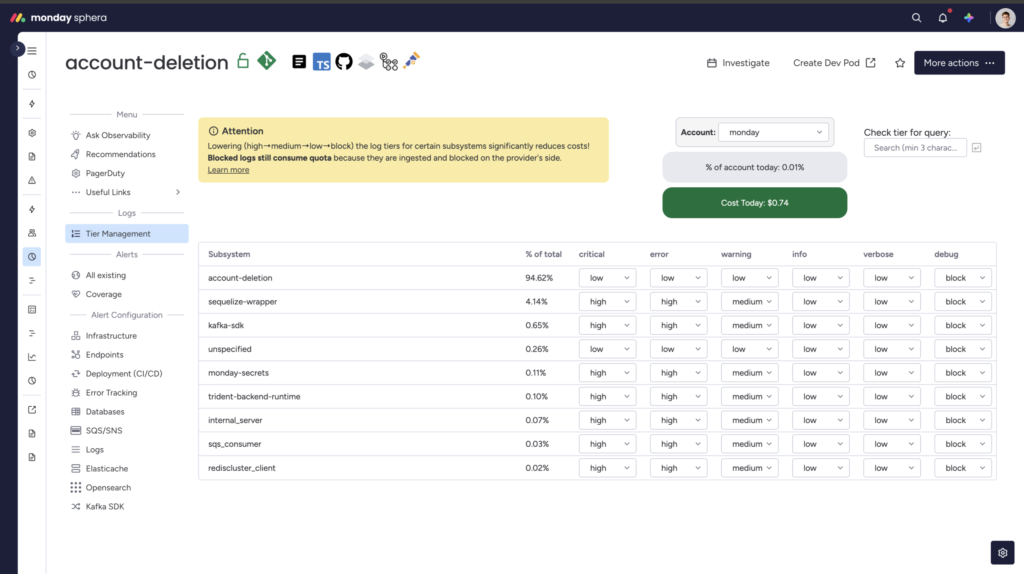
Our logging system uses tiers for storing logs, allowing teams to drastically optimize storage costs for high-volume, non-critical debug logs that don’t require active alerting or real-time dashboards.
By default, only info and lower log levels are sent to the lowest tier. Errors and warnings will end up in the alerting-capable tiers. However, not all errors are equal. Some subsystems of your service are mission-critical, while issues in others can be just logged for debugging. Observability Guard gives developers this flexibility. Every subsystem can be managed differently, on the fly. The change is propagated instantly to the provider’s systems.
It’s the exact same vision we brought to alerting: shifting complex operational decisions away from manual code changes and onto a unified, automated control plane.
Adoption
Promoting new features at monday.com is easy; we regularly share the advancements on Slack channels with all Builders. We have bi-weekly summaries of small improvements from all the Infra teams. And there are Learning & Development sessions where you can do a live demo and win people over.
It doesn’t mean everyone switched overnight; it was still a long, gradual process. But every time someone approached us for help with the alerting setup, we promoted the Observability Guard. If it couldn’t do what they needed, we added that feature. We prioritized the development, at the cost of other tasks in the backlog, because we were confident it would save us time in the long run.
But what’s most important is that Observability Guard genuinely makes engineers’ lives easier, and they want to use it; they want it to improve. No one misses clicking through three different platforms to set up alerts or finding out that the monitor doesn’t work because of wrong assumptions about data aggregation.
Centralized platforms shouldn’t add toil or be yet another place to visit on the service’s onboarding journey. They should shift focus from external, specialized platforms to a single pane of glass that lets engineers do most of the work. They’ll still need to visit them for in-depth investigations, but they should always start in a familiar place that’s always up to date.
Groundwork for Mandatory Alerts
For over a year, the Observability Guard was an opt-in feature. Over this time, it has become the standard way of creating alerts.
This year, we moved even further, introducing mandatory alerts for the signals we are the most confident in. Observability Guard provides a strong foundation for such an initiative. It alleviated the technical issues, allowing the focus to be solely on the social perspective. It’s hard to convince teams to let external forces into their carefully crafted alerting schemes. But to take our system reliability to the next level, we had to develop a process to enable confident adoption. How did we do that while minimizing disruption to our colleagues’ sleep and keeping the number of false positives low? That’s a story for another blog post.
What It Gave Us
We started this journey looking at the cycle every software engineer has lived through: the 3 AM page, broken dashboard, missing runbook, and the ghost of a predecessor who left the company months ago.
At a scale of 600+ services and 10 different vendors, solving this wasn’t about nagging developers to write better documentation or manually build their alerts. It required a complete redefinition of where and how observability happens.
By building Observability Guard directly into Sphera, we turned observability from the least favorite chore into an automated, out-of-the-box standard.
The New Normal at monday.com
Shifting the alerting control plane to our Internal Developer Portal has rewritten the rules of how we scale observability:
- For our Human Engineers: It provides a single pane of glass that eliminates platform-hopping, automatically calculates smart thresholds, and ensures that an accurate, crowdsourced runbook is always attached to an alert.
- For our AI SRE Agents: It establishes a clean, predictable data contract, allowing LLMs to accurately correlate signals without tripping over a messy web of custom alert configurations.
- For our Infrastructure: It guarantees robust visibility across hundreds of services without sacrificing the tool autonomy that fuels our engineering culture.
Turning Tribal into Institutional
Centralized platforms shouldn’t just be another tool in the shed; they should optimize the entire process by institutionalizing the tribal knowledge of your best engineers.
Observability shouldn’t require you to be a digital archaeologist every time a service acts up. By abstracting away the low-level noise, automating the baselines, and building a culture of shared infrastructure ownership, we gave our engineers their peace of mind back.
This kind of cultural shift doesn’t happen overnight. You have to start small and win people over with obvious, immediate quality-of-life improvements. But when you make doing the right thing the easiest path available, you don’t just build a more resilient system. You ensure everyone finally gets a good night’s sleep.