Less Noise, Better Sleep: Data-Driven Approach to Healthier Alerts
End-to-end ownership is one of monday.com’s central values, so it will come as no surprise that, as engineers, we have full ownership of our teams’ domains. “With great power comes great responsibility,” and one of them is on-call schedules. All engineers who join our company go on call within 3-6 months. The shift usually lasts 24 hours or 7 days, depending on the team.
During this time, as an engineer on-call, you’re expected to acknowledge the alert, quickly establish the nature of the problem, and start investigating the root cause on your own or call in other team members for help.
While this process guarantees that every potential production alert is addressed immediately, the short-rotation shift comes with several shortcomings. In our case, those disadvantages slowly turned into real problems, such as:
- Lack of a “birds’ eye view” – when you’re on-call once in a while, the recurring patterns are easy to miss. This is especially true for less critical issues that still impact the system’s long-term reliability.
- Blurred ownership over alert ownership, causing false positives or noisy alerts not to be fixed immediately. This, in turn, leads to increased alert fatigue – next time there is a real issue, you might not react quickly enough.
- Issues are being “handled” but not fully resolved, allowing regressions or gradual performance degradation to slowly creep into our system.
Step 1: Make Every Alert Count (Even the Bad Ones)
So you have a sense of the problem, but you’re not sure where to even start. What would you do? At monday.com, we follow the quote “You can’t improve what you can’t measure,” and we believe the data is the starting point of most problems. This situation was not different. We needed to know the stats behind our production alerts.
As we’re also a company that believes in dogfooding, it should come as no surprise that we chose monday.com as the tool for collecting and analyzing data on our alerts. Using a built-in PagerDuty integration, we set up an automation that creates an item in a dedicated board for every new production alert.
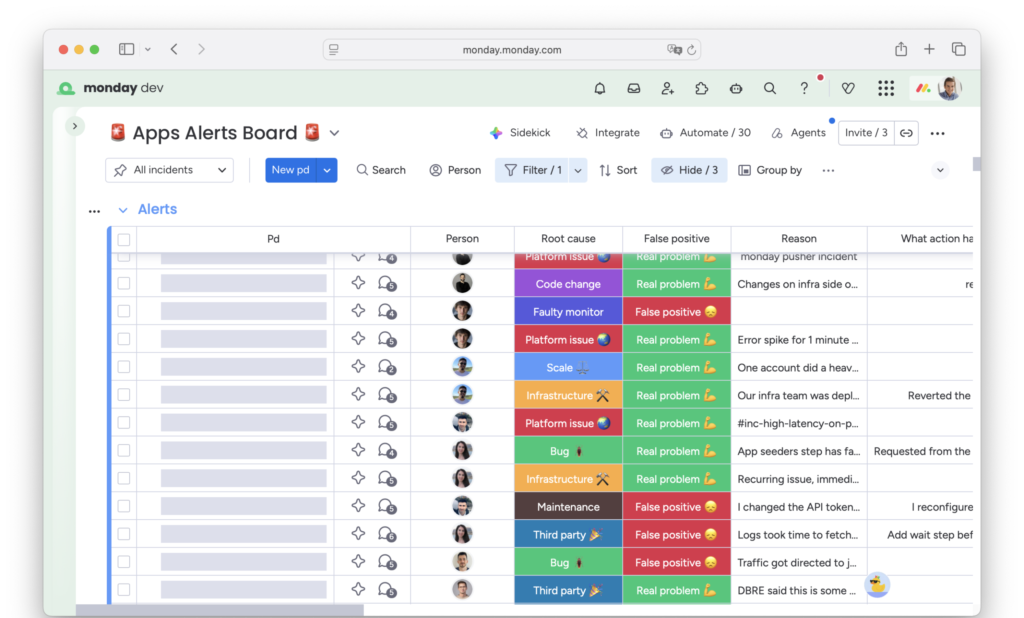
Monday.com board tracking our production alerts
But the raw data from PagerDuty alerts was not enough to provide an answer to the following questions:
- Was this a true or false positive? In case of the latter, what was done to make sure that it will not be falsely triggered again?
- What was the root cause of the alert? An actual, faulty code change, growing scale, or misconfiguration? Or maybe a flaky test or misconfigured alert?
- Was this a duplicate? In many cases, a single prod issue may trigger multiple alerts, and they should be counted differently.
To close this gap, we added several columns to our alert board. Those needed to be filled in by the engineering on-call after the alert was resolved. Since such a chore is easy to forget, we created another automation that sends recurring reminders on Slack until all required fields are filled.
Step 2: Look at the Data Together
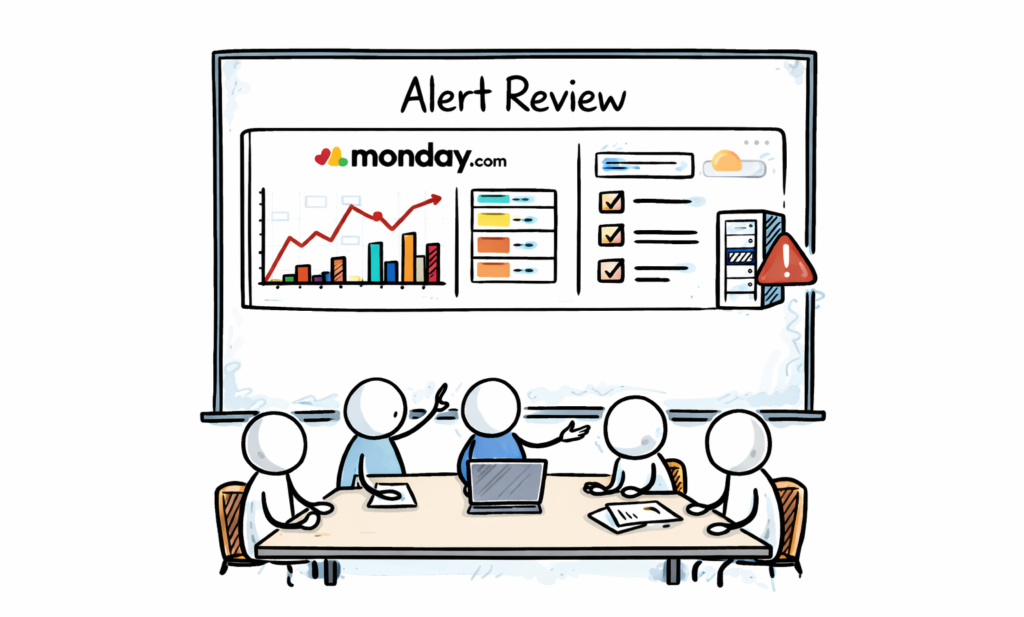
After some time, we gathered enough data to begin analyzing it and drawing initial conclusions. An ideal forum for such discussion is the QER (Quarterly Engineering Review). It is a meeting held every 3 months where we all present and discuss the state of our domain from a purely technical, engineering angle.
QERs were the perfect place to review all the alerts from the past 3 months. And since we’re storing the data in monday.com boards, it was extremely easy to visualize.
The main things we were looking at in every QER were:
- Alert trends – Were we getting more or fewer production alerts than Q before? What about false positives?
- Problematic areas – Which services were most noisy?
- Biggest offenders – What were the alerts that got triggered most often? And why?
Step 3: Turn Alerts into Backlog Items
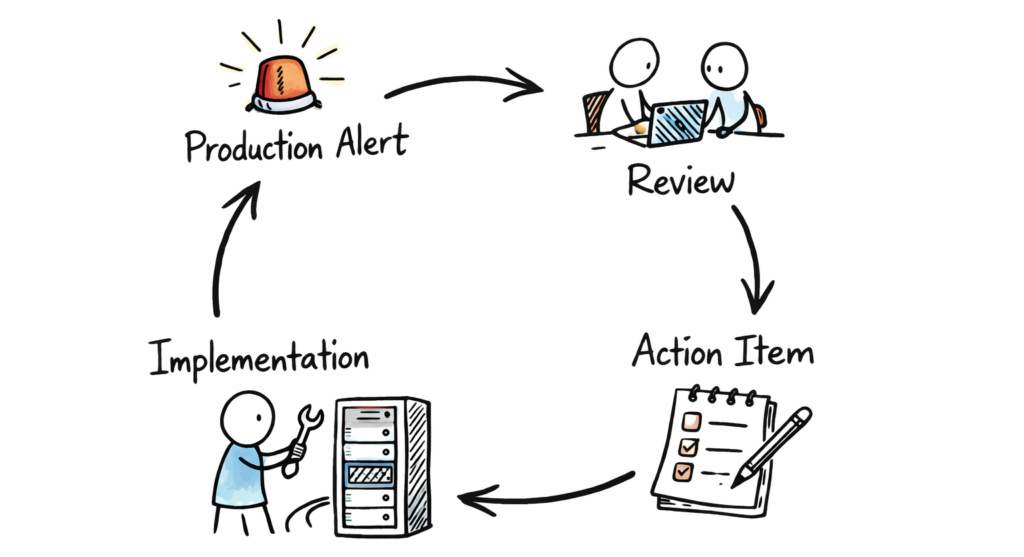
Alerts feedback loop
Analyzing and discussing the data is a great way to align everyone on the current state of production alerts. But it won’t move the needle without actionable follow-ups. So, each QER ended up with a list of action items we committed to working on in the following months to improve the state of production alerts and the quality of on-call schedules.
Example of such action items:
- Fine-tune alerts to make them less sensitive to noise or flakiness
- Remove alerts that we believe bring little value
- Improve code areas that frequently experience spikes in performance metrics.
Since all action items are based on hard data from previous alerts and their impact is measurable, it is much easier to prioritize them in the team’s backlog. Instead of saying vaguely, “We need to work on this to improve the code quality,” we were now able to state clearly, “We need to work on this because this alert paged us 10 times and cost us 7 engineer-hours last quarter.”
Finally, at the beginning of the next QER, we reviewed the status of all action items we committed to implement, whether they helped improve production health, and discussed those that were not completed. This way, we closed the feedback loop circle and started the “iteration” of improvements to engineering quality.
The Payoff
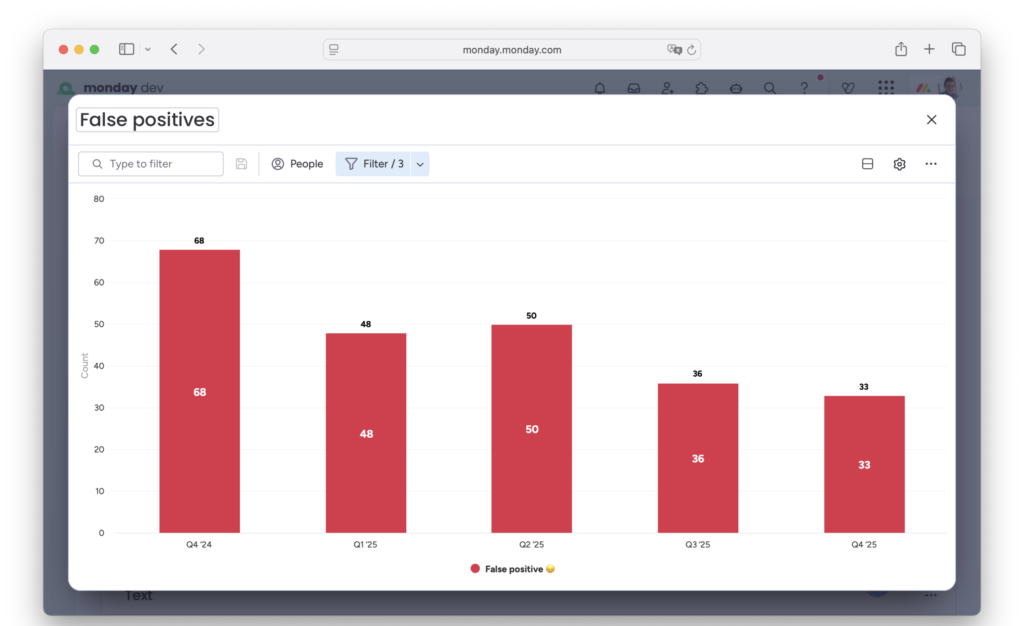
Reduction of false positives
This framework has been in place for more than a year in the Open Platform group that consists of approximately 20 engineers from our Apps, API, and Marketplace teams. During this time, we managed to achieve:
- 2x fewer false-positive alerts – Both in absolute numbers, as well as percentage of total number of alerts received. This used to be one of the main pain points for our on-call team and a primary focus of the improvement process.
- Improved resiliency of areas that were most affected by performance issues and significantly reduced “short-lived spike” types of alerts.
- Raised awareness of production alerts and their issues across our entire engineering group. While it was standard for us to continuously improve areas like code quality, test coverage, or architecture, we now also have a framework to constantly improve the quality of our production alerts and the on-call schedule.
While there are still plenty of areas for improvement, we can now plan and prioritize next steps based on rich historical data.
Your Alerts are Data — Treat Them That Way
This journey toward healthier production alerts didn’t start with a grand overhaul — it began with a simple decision to collect and enrich the data about what was happening. By embracing this data-driven workflow, creating shared visibility, and committing to continuous iteration, production alert quality can become a first-class part of engineering excellence.